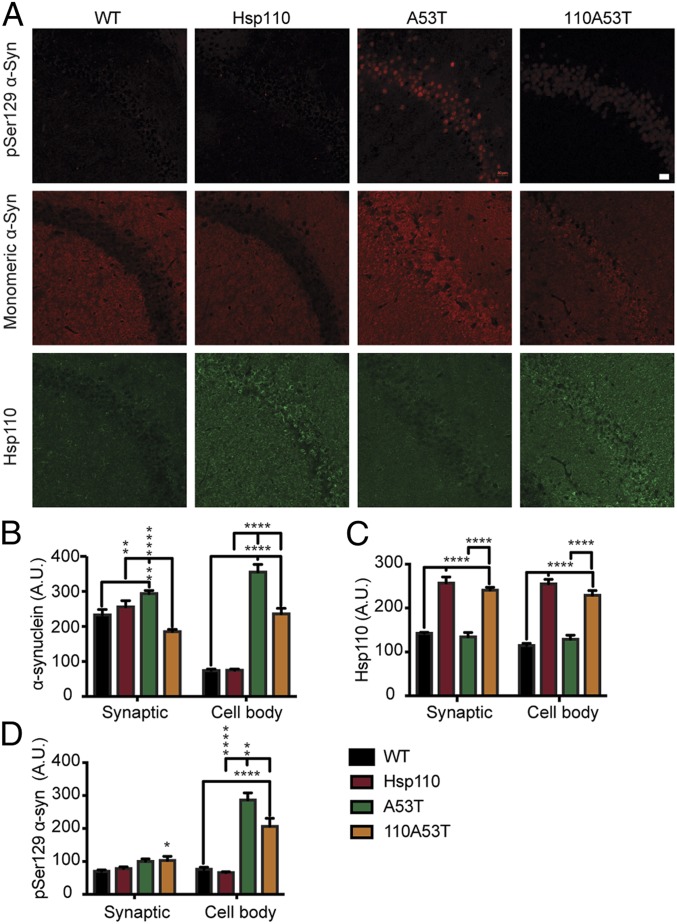
Fig. 4.
Characterization of α-synuclein pathology in 110A53T brains. (A) Representative fluorescence images of 6-mo-old WT, Hsp110, A53T, and 110A53T mouse CA1 of hippocampus. First row of images: pSer129–α-synuclein in red; second row, total α-synuclein in red; and third row, Hsp110 in green. (Scale bar, 20 μm, applies to all panels.) (B) Quantification of total α-synuclein levels in cell body layer as well as synaptic regions; n = 3 mice per genotype. (C) Quantification of Hsp110 levels in cell body layer and in synaptic regions; n = 3 mice per genotype. (D) Quantification of pSer129–α-synuclein levels in cell body layer and in synaptic regions, n = 3 mice per genotype. Data were analyzed by ANOVA; *P value < 0.05; **P value < 0.01; ****P value < 0.0001.

