Figure 3.
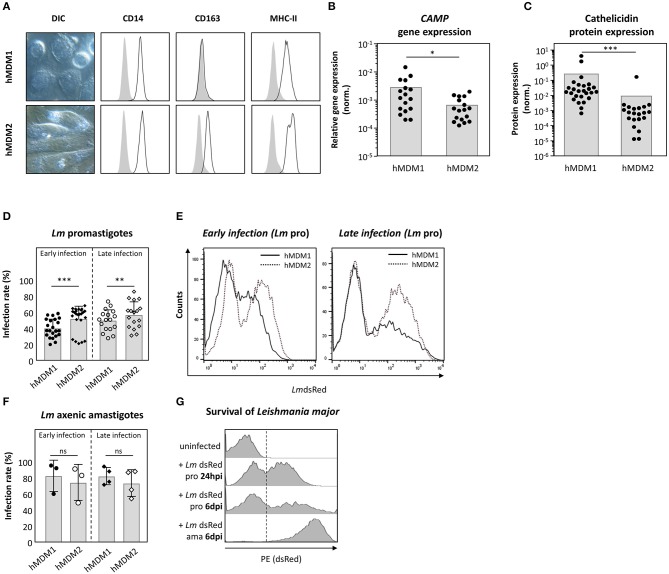
Expression of cathelicidin is more prominent in pro-inflammatory hMDM1 then in anti-inflammatory hMDM2. (A) Live cell imaging DIC micrographs of inflammatory hMDM1 and anti-inflammatory hMDM2, characterized by flow cytometry for CD14, CD163, and MHC-II surface expression (black line) in line with the isotype controls (gray). (B,C) CAMP gene expression (n = 17) (B) and cathelicidin protein expression (n = 21) (C) were assessed in hMDM1 and hMDM2 by qRT-PCR and western blot. CAMP expression was normalized against the house keeping gene GAPHD. Western blots were analyzed by densitometry (ImageJ analysis), normalizing cathelicidin against ß-actin protein expression. (D–F) Both hMDM1 and hMDM2 were infected with either transgenic Lm pro (n = 22–24) (D,E) or ama (n = 3–4) (F) (MOI of 10). After 3 h, extracellular parasites were removed by washing following incubation at 37°C, 5% CO2. After 24–48 hpi (early infection) or 6–7 dpi (late infection) infection rate was assessed by flow cytometry. (G) Lm dsRed pro transform into ama over time, indicated by an increased fluorescent intensity. Micrographs, histograms and data, presented as mean ± SD, are representative for at least 3 independent experiments (Wilcoxon matched-pairs signed rank test; *p < 0.05; **p < 0.01; ***p < 0.001; ns, not significant; pro, promastigotes; ama, amastigotes).

