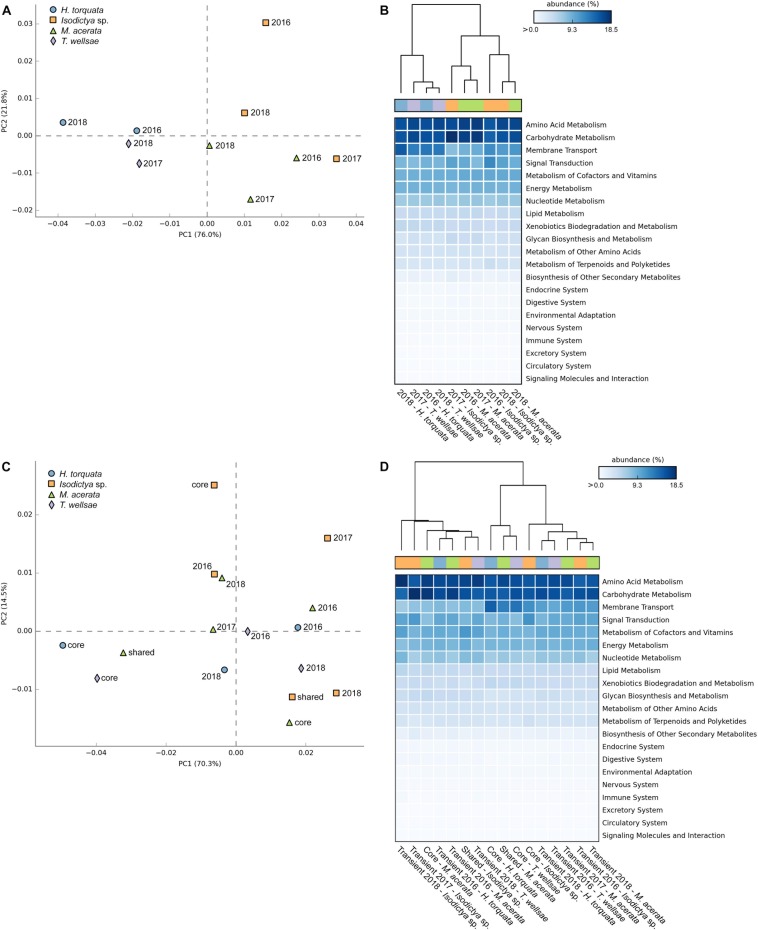
FIGURE 5.
PCA, heatmap, and hierarchical clustering visualizations of the KEGG pathway relative abundance profiles for panels (A) and (B) the predicted functional pathways among the four sponge species over time, and panels (C) and (D) the predicted functional pathways of the core, shared, and transient sponge-associated bacterial communities.

