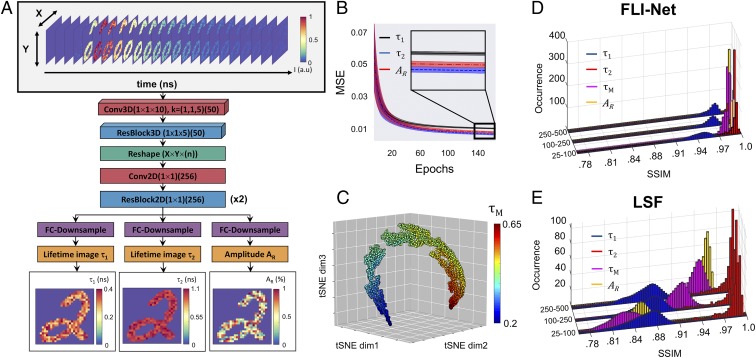
Fig. 1.
Illustration of the 3D-CNN FLI-Net structure and corresponding metrics. During the training phase, the input to the DNN (A) was a set of simulated data voxels containing a TPSF at every nonzero value of a randomly chosen MNIST image. After a series of spatially independent 3D convolutions, the voxel underwent a reshape (from 4D to 3D) and is subsequently branched into 3 separate series of fully convolutional down-sampling for simultaneous spatially resolved quantification of 3 parameters, including short lifetime (), long lifetime (), and fractional amplitude of the short lifetime (). (B) The 30-MSE validation curve average with corresponding SD (shaded) for each parameter. (C) t-SNE visualization obtained via the last activation map before the trijunction reconstruction, where each point represents a TPSF voxel assigned a randomized trio of lifetime and amplitude ratio values. (D and E) FLI-Net performance (D) versus LSF (E) upon evaluation of simulated TPSF voxels over 3 ranges of maximum photon count (25 to 100, 100 to 250, and 250 to 500 p.c.). Parameters of interest include and mean lifetime ( Eq. 2).

