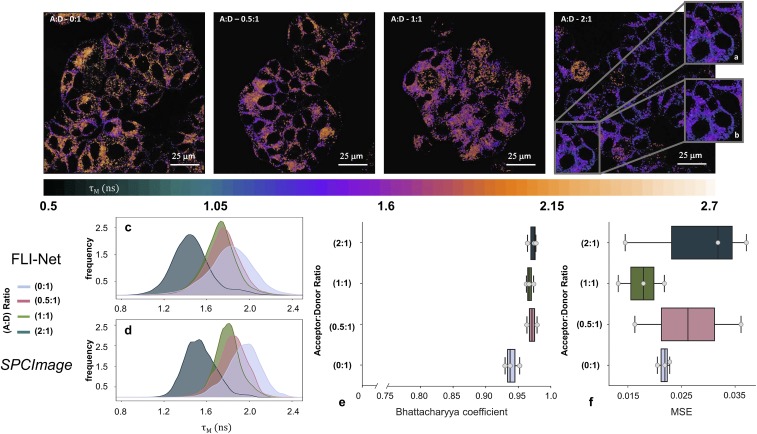
Fig. 3.
Visible FLIM microscopy data. (Top) T47D human breast cancer cells were incubated with different A:D ratios of Tf-AF488 (donor, D) and Tf-AF555 (acceptor, A) for 1 h. FLI signal is reduced due to the occurrence of FRET when Tf-AF488 and Tf-AF555 bind to their respective receptor at the plasma membrane as well as during subsequent internalization of the receptor–ligand complexes. Shown are representative maps obtained via FLI-Net using T47D cells containing Tf-AF488 (A:D = 0:1; negative control) or different donor:acceptor ratios of Tf-AF488 and Tf-AF555 (0.5:1, 1:1, and 2:1). (A and B) Representative ROI comparison between FLI-Net (A) and SPCImage (B). (Bottom) (C and D) Distribution histograms of obtained via FLI-Net compared to SPCImage. (E and F) Bhattacharyya coefficient and MSE were calculated for whole images at each A:D ratio. Error bars are SD with n = 3. Further metrics of note are included in SI Appendix, SI Text (SI Appendix, Figs. S7–S9).

