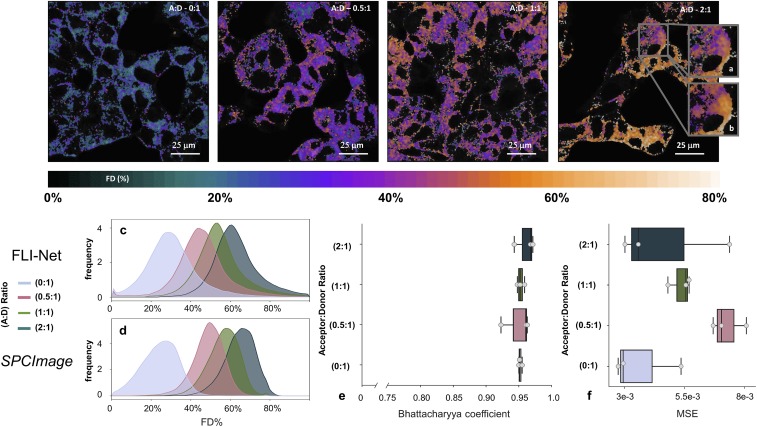
Fig. 4.
NIR TCSPC FLIM microscopy data. (Top) Representative FRET FD% maps obtained via FLI-Net using T47D cells containing Tf-AF700 (A:D = 0:1) or A:D ratios of Tf-AF700 and Tf-AF750 (0.5:1, 1:1, and 2:1). Cells were treated similarly to those in Fig. 3 using differently labeled Tf molecules. (A and B) Example ROI comparison between FLI-Net (A) and SPCImage (B). (Bottom) (C and D) FD% distribution overlays for both techniques. (E and F) Bhattacharyya coefficient and MSE were calculated for whole images at each A:D ratio. Error bars are SD with n = 3. Further metrics of note are included in SI Appendix, SI Text (SI Appendix, Figs. S12–S14).

