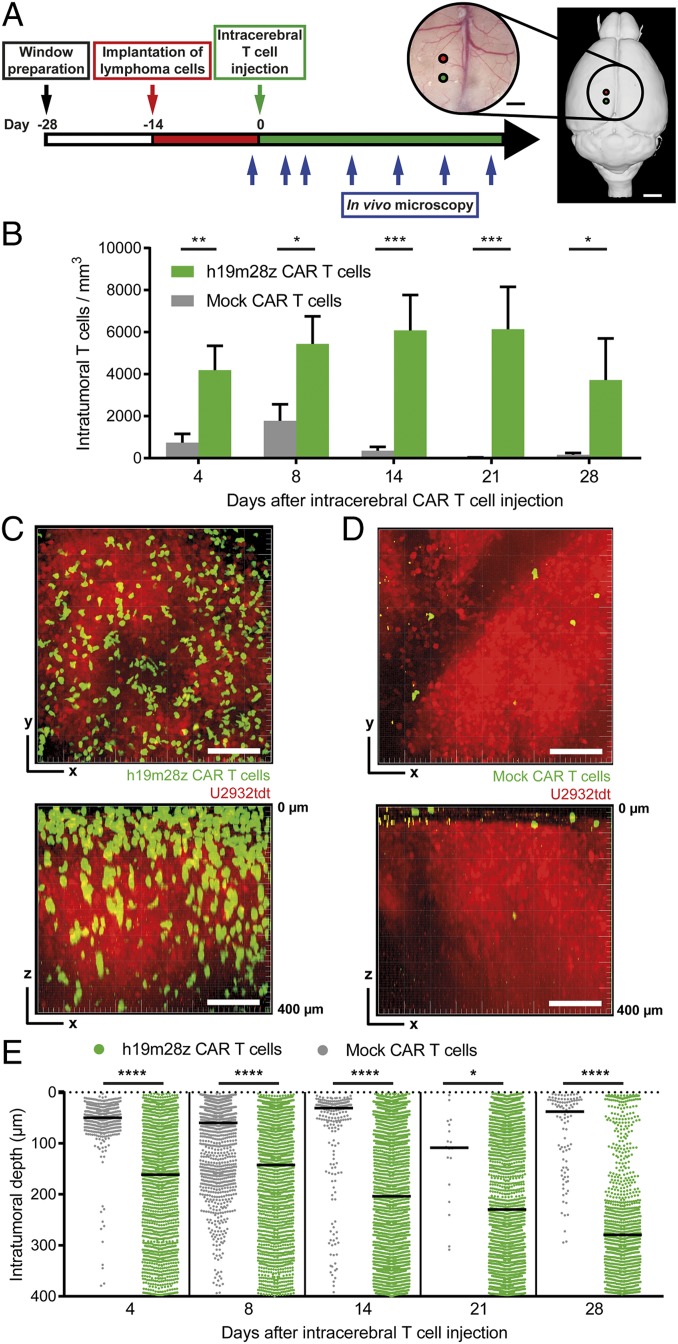
Fig. 3.
After intracerebral injection, intratumoral h19m28z CAR T cells are present at higher numbers and persist longer than mock CAR T cells. (A) Schematic representation illustrating experimental design. Right panel created with 3dBAR/SBA (53–55). (B) Intratumoral CAR T cell numbers in mice treated with intracerebral mock or h19m28z CAR T cells. Quantification of 1 to 2 3D ROIs (depending on tumor size) per mouse. n = 4 mice per group from 2 independent experiments. (C and D) Representative maximum intensity projections of axial (xy; Upper) and sagittal (xz; Lower) orientation illustrating intratumoral h19m28z (C) and mock (D) CAR T cells 14 d after CAR T cell injection. (Scale bars: 100 µm.) (E) Distance of intratumoral CAR T cells from brain surface. n = 1 to 2 3D ROIs of 4 mice per group from 2 independent experiments. Each point represents an individual mock or h19m28z CAR T cell. T cell number and position after tumor regression (day 28: 2 of 4 mice in the h19m28z group, 0 of 4 in the mock group) have been excluded. Data are shown as mean + SEM (B) or median (E). Mann–Whitney U test (B and E). ns, not significant. *P < 0.05; **P < 0.01; ***P < 0.001; ****P < 0.0001.

