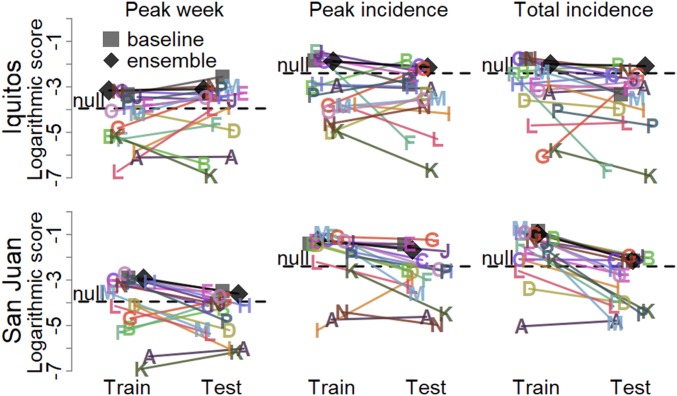
Fig. 4.
Overall forecast scores for weeks 0 to 24 in the training (2005/2006 to 2008/2009) and testing (2009/2010 to 2012/2013) seasons. Each point is the average target- and location-specific log score for a model in the training (left side; light shading) and testing (right side; dark shading) seasons. The horizontal dispersion within training and testing scores is random to improve visualization. The null forecast for each target is represented by a horizontal line. Numerous forecasts assigned 0 probability to at least 1 observed outcome. Those individual forecast probabilities were changed to 0.001 before calculating the logarithmic scores.

