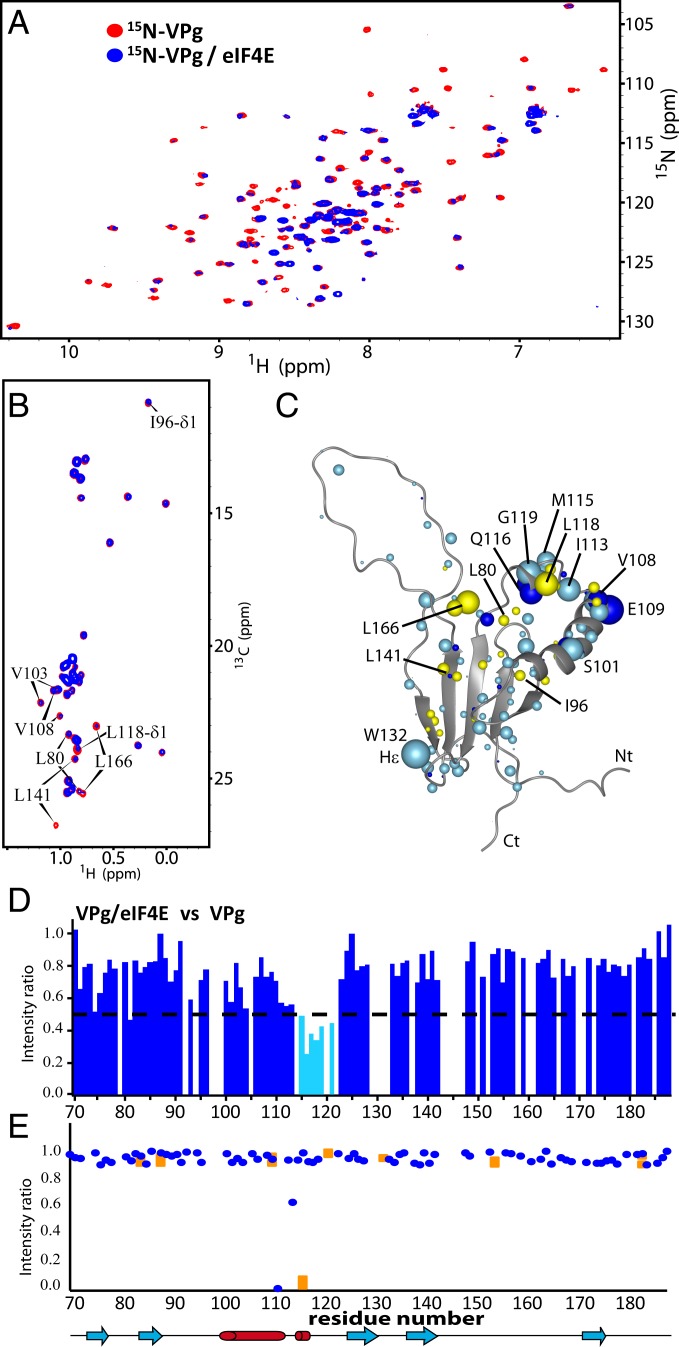
Fig. 2.
The binding surface on VPg used to interact with eIF4E. (A) 1H-15N HSQC of 50 μM 15N-labeled VPg in the absence (red) or presence (blue) of a 3-molar excess of unlabeled eIF4E. (B) Constant time 1H-13C HSQC spectrum of ILV-labeled VPg (50 μM) in the absence (red) or presence of 2-molar excess eIF4E (blue). (C) VPg residues are perturbed by eIF4E binding. Light blue indicates 1H CSP or broadening, dark blue indicates 1H methyl CSP, and yellow indicates broadening from the 1H-13C projection of the 3D HNCO spectra (SI Appendix, Fig. S5). (D) Per residue plot of backbone amide line broadening of 15N-labeled VPgΔ37 in response to binding of eIF4E (extracted from A). Residues that undergo line broadening below the dashed line are in cyan. Note that empty spaces correspond to residues that overlap, residues that are not assigned, or Proline residues. (E) Plot of the intensity ratios of the cross-peaks in the TCS experiment for the backbone (blue) and asparagine/glutamine side-chain (orange) resonances for VPg.

