Fig. 4.
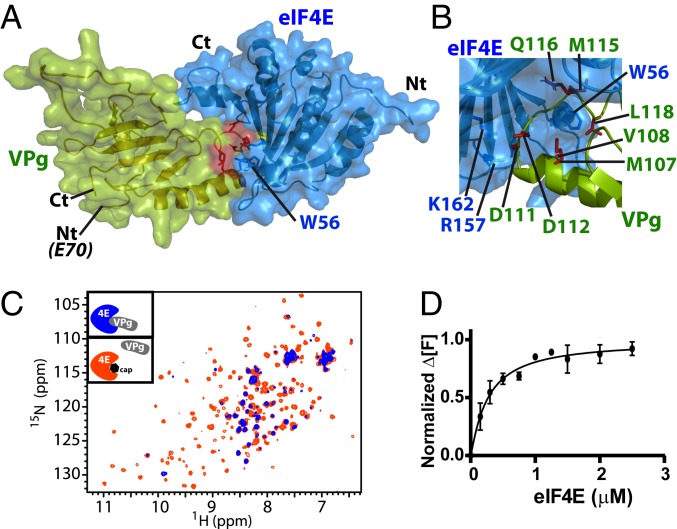
(A) Restraint-driven model of the VPg (green) and eIF4E (blue) complex. Red highlights W56 from eIF4E involved in the association with VPg (SI Appendix, Fig. S8C). (B) Close-up view of the complex highlighting the positive patch on eIF4E and its interaction with negative residues on VPg (rotation of 120° compared with A). This region was confirmed to bind eIF4E by mutation (SI Appendix, Fig. S8 B and E). (C) Overlay of the HSQC spectra of 15N-labeled eIF4E (50 μM) in the presence of 3-fold excess of unlabeled VPg (blue) and after addition of 20-fold molar excess of m7GDP relative to eIF4E (orange), demonstrating that VPg and the cap compete for overlapping binding surfaces on eIF4E. (D) eIF4E specifically binds to VPg with submicromolar affinity (∼0.3 μM). Normalized change in fluorescence at emission of 484 nm (Δ[F]) as a function of eIF4E concentration for 0.5 μM VPgΔ37. Measurements were carried out 3 independent times.

