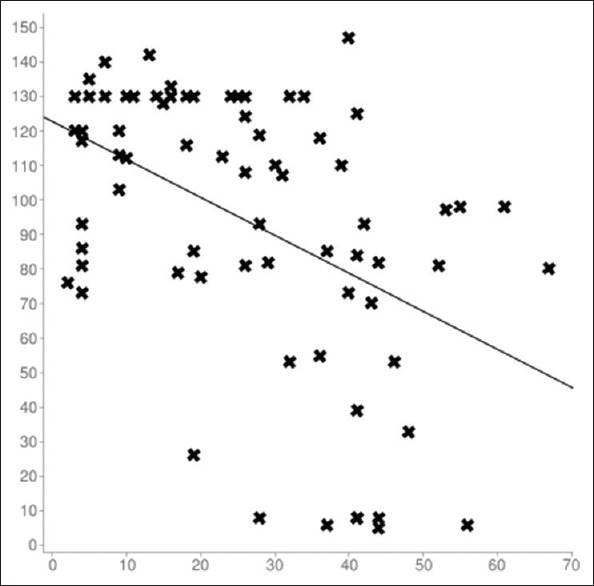
Figure 1.

Linear correlation between age at diagnosis and eGFRvariables. Sample size: 72; Mean x (x̄): 26.263888888889; Mean y (ȳ): 93.825; Intercept (a): 122.67968223109; Slope (b): −1.0986446962655; Regression line equation: y = 122.67968223109-1.0986446962655x. Ref: X axis: age (in years); Y axis: eGFR (in ml/min/m2)
