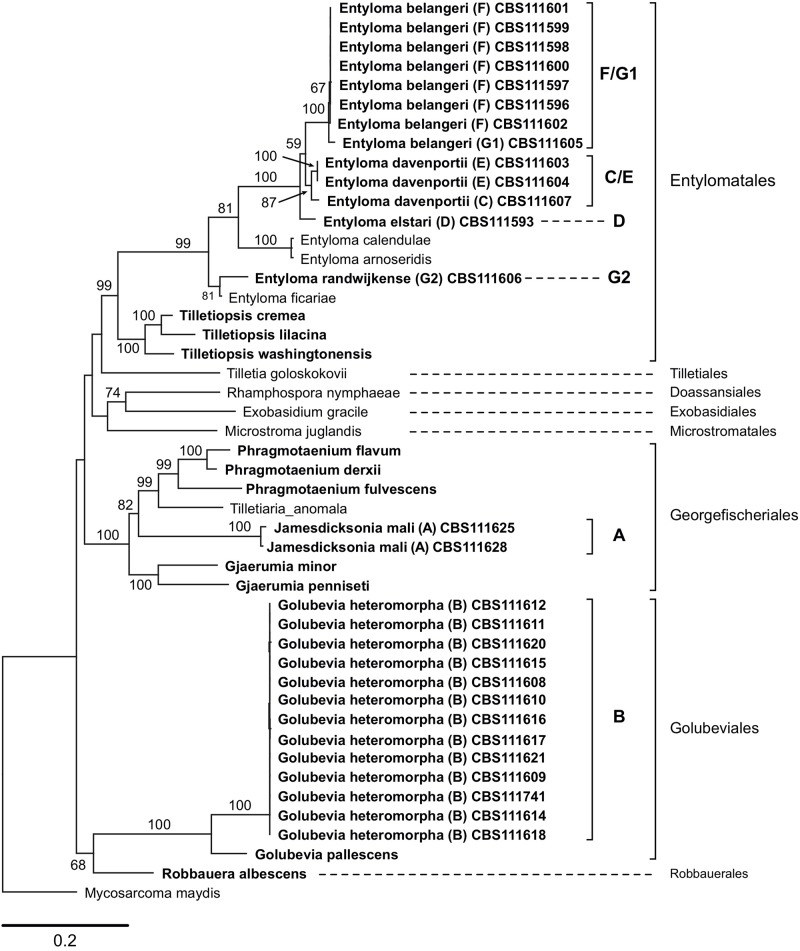
FIGURE 1.
Maximum likelihood analysis of a five-loci alignment combining sequences of the ITS region (including 5.8S rRNA gene), LSU (D1/D2 domains), and SSU rRNA gene, RPB2, and TEF1, showing the relationships of taxa within the Exobasidiomycetes. The numbers on branches are frequencies (>50%) with which a given branch appeared in 1000 bootstrap replications. The scale bars indicate the numbers of expected substitutions accumulated per site. Nucleotide sequences of Tilletiopsis-like fungi are in bold; clade classification (A–G) follows (Boekhout et al., 2006).

