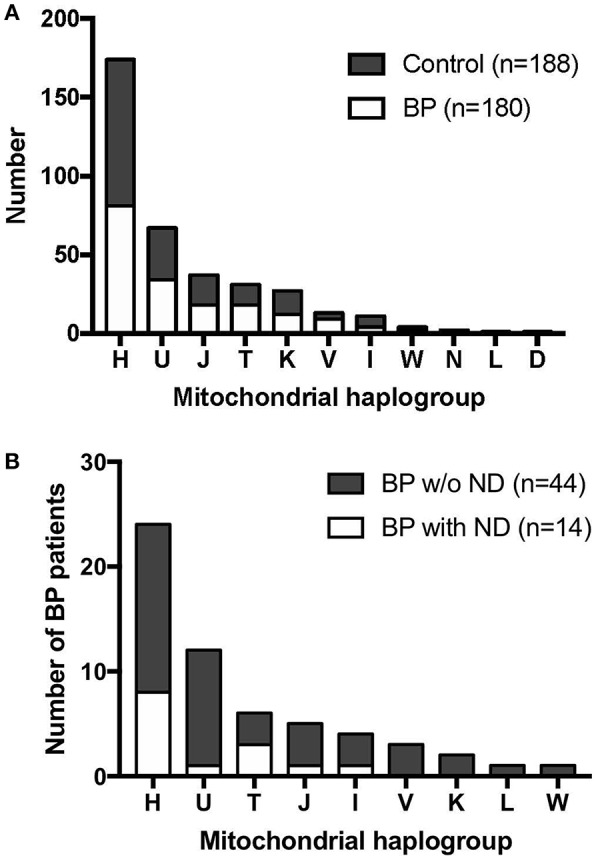
Figure 1.

Mitochondrial haplogroup distribution in BP patients and controls. (A) BP patients and controls showed similar mitochondrial haplogroup distributions. (B) Mitochondrial haplogroup distribution when BP patients were stratified for clinical history of neurodegenerative diseases (ND). BP patients with the haplogroup T background tended to have higher incidence of ND.
