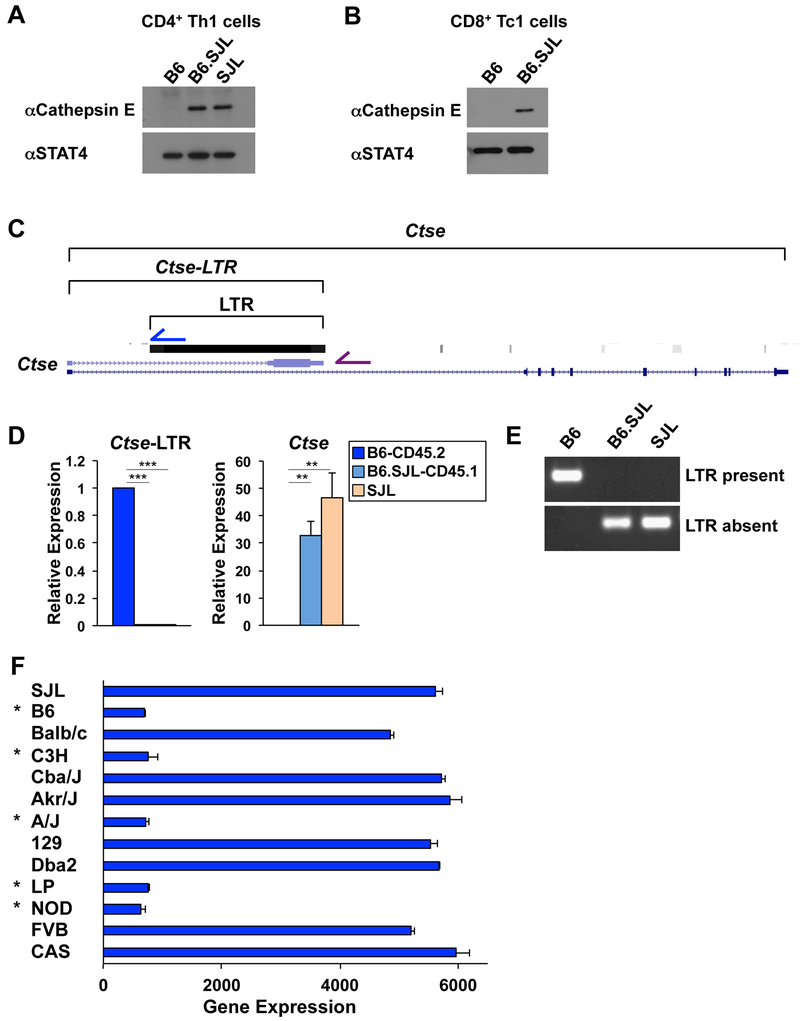
Figure 2. Viral integration impacts cathepsin E expression.
(A, D) CD4+ or (B) CD8+ T cells were isolated from B6-CD45.2, B6.SJL-CD45.1, or SJL mice from Jax and cells were polarized in Th1 conditions. (A, B) Western blot analysis of cathepsin E protein expression with STAT4 as a control. (C) Schematic of Ctse locus displaying the location of an alternative Ctse annotation (Ctse-LTR) and a viral LTR integration. (D) qRT-PCR analysis of Ctse and Ctse-LTR transcripts. Transcripts were normalized to Rps18 as a control and then expression levels were compared relative to B6-CD45.2 genotype cells. (E) PCR analysis of DNA isolated from B6-CD45.2, B6.SJL-CD45.1, or SJL mice using a common forward primer, with either a reverse primer inside (blue arrow in (C); LTR present) or outside (purple arrow in (C); LTR absent) of the LTR. (F) Ctse expression in CD4+ T cells isolated from mouse strains indicated to the left of the graph as defined in ImmGen datasets (GSE60337). Asterisks indicate strains that have the viral integration in the first intron of Ctse. (A, B, D, E) Data are compiled from, or representative of, at least (E) 2 or (A, B, D) 3 independent biological replicates. (D, F) Error bars represent standard error of the mean (SEM) and (D) p-values were calculated by an unpaired Student’s t test (***≤ 0.001 and ** ≤ 0.01). See also Fig. S2.

