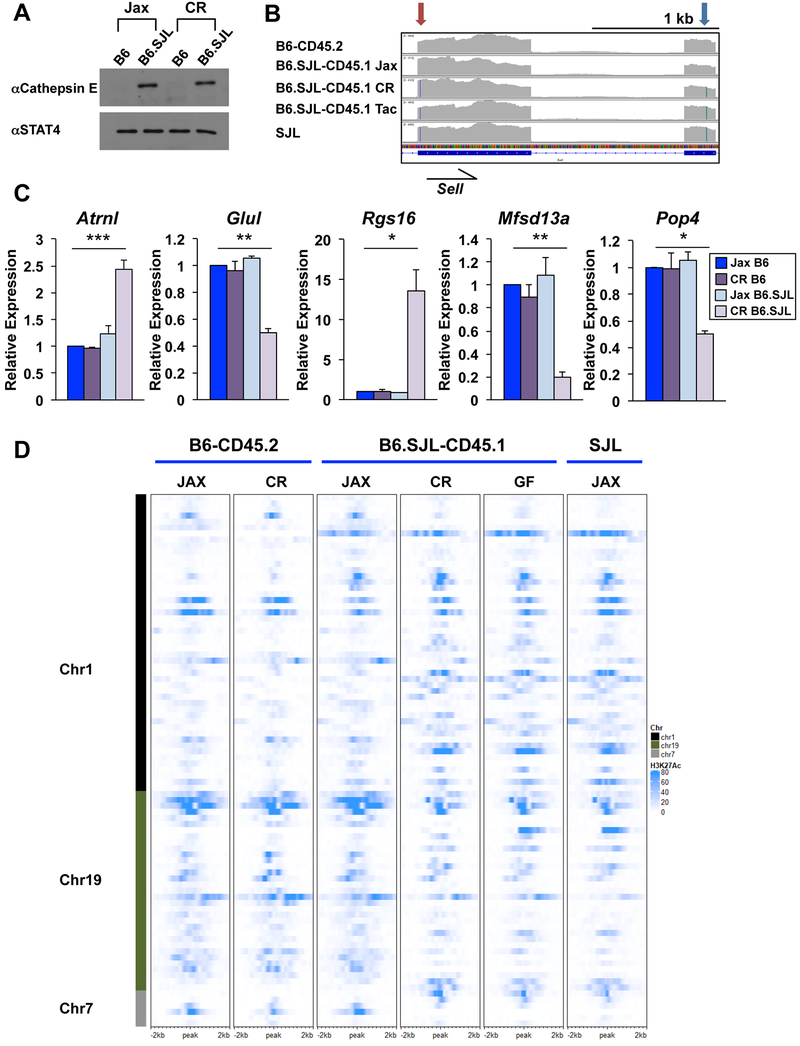
Figure 5. SJL genetic content functionally impacts CD4+ Th1 cells from B6.SJL-CD45.1 mice.
(A-D) CD4+ T cells were isolated from B6-CD45.2 or B6.SJL-CD45.1 mice from Jax, CR, or Tac and polarized in Th1 conditions (vendor indicated in panels). (A) Western blot analysis of cathepsin E protein expression with STAT4 shown as a control. (B) IGV browser display of RNA-seq default alignment files as indicated. Partial Sell transcript is shown indicating nucleotide substitutions in the C-type lectin (red arrow) and Egf-like (blue arrow) domains. Color lines in transcript coverage denote nucleotide change from mm10 genome as indicated in Fig. 3F. (C) qRT-PCR of genes on chromosomes 1, 7, or 19 of CD4+ Th1 cells isolated from B6-CD45.2 or B6.SJL-CD45.1 mice from Jax (blue) or CR (purple) as indicated. Error bars represent SEM and p values were calculated with an unpaired Student’s t test (*** ≤ 0.001, ** ≤ 0.01, and * ≤ 0.05). (D) Heatmap of H3K27Ac ChIP-seq datasets from CD4+ Th1 cells isolated from B6-CD45.2, B6.SJL-CD45.1 or SJL mice from Jax or CR. H3K27Ac ChIP-seq data from B6.SJL-CD45.1 germ-free (GF) mice are also shown. See methods for heatmap peak selection. Data are compiled from, or representative of, at least (A, D) 2 or (B, C) 3 independent biological replicates. See also Fig. S6.

