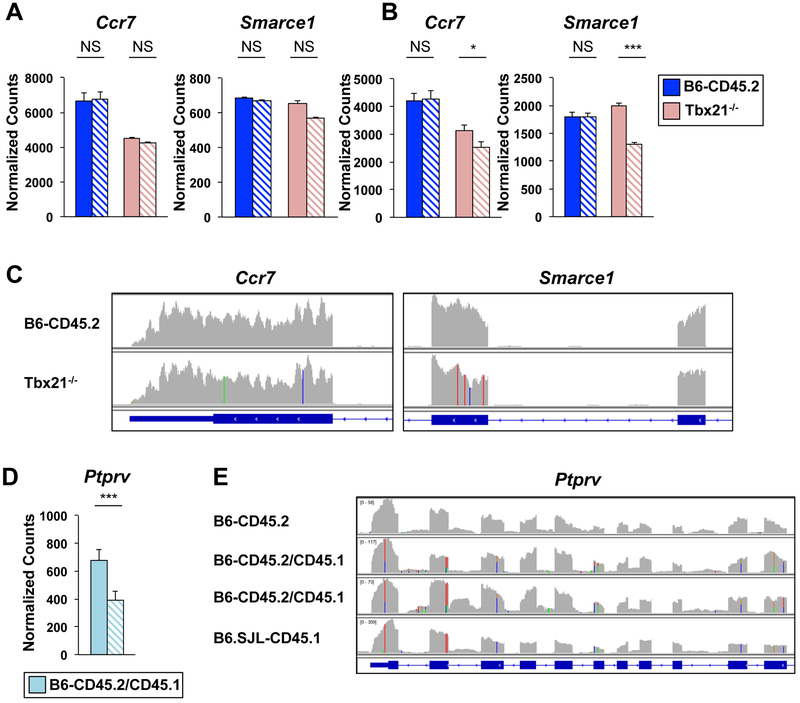
Figure 7. 129 genetic content was detected in Tbx21−/− transcripts.
(A-C) CD4+ T cells were isolated from B6-CD45.2 or Tbx21−/− mice or (D-E) B6-CD45.2/CD45.1 heterozygous mice and polarized in Th1 conditions. RNA-seq was performed with (A, C) 50bp single-end or (B, D, E) 150bp paired-end reads on two independent biological replicates. Graphs of normalized counts for RNA-seq data from (A, B) B6-CD45.2 (dark blue) and Tbx2T−/− (pink) or (D) B6-CD45.2/CD45.1 (light blue) mice processed with default (solid bars) or stringent (hatched bars) parameters. P-values defined by DESeq2 analysis (***≤ 0.001, * ≤ 0.05). (C, E) IGV browser tracks displaying RNA-seq alignments from default processing parameters with nucleotide changes from the mm10 genome displayed as in Fig. 3F. See also Fig. S7.

