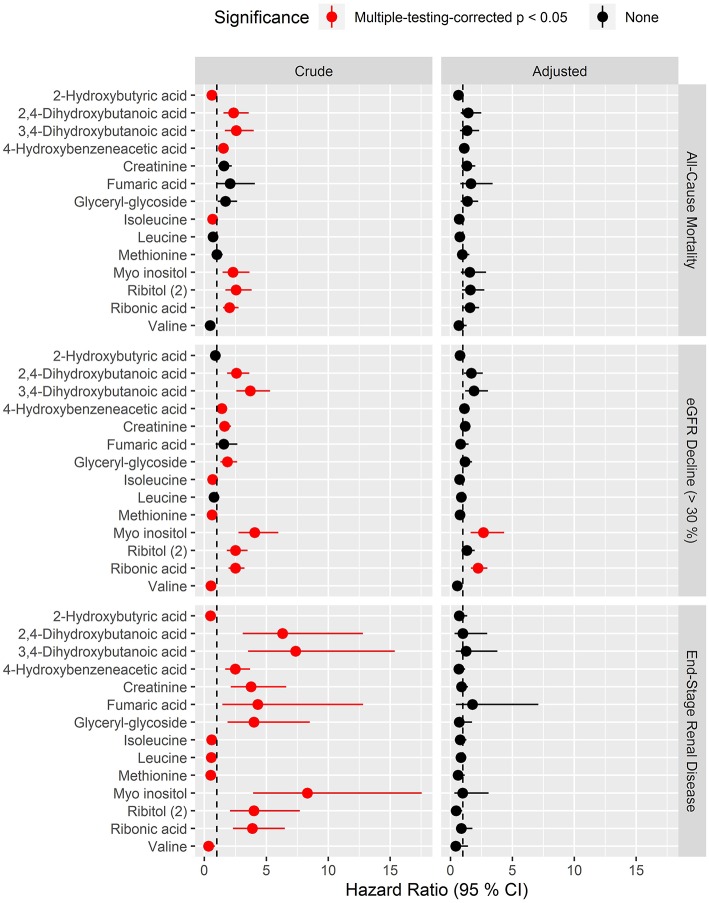
Figure 4.
Hazard ratios of prioritized metabolites for progression to the three specific endpoints: all-cause mortality, eGFR decline (>30%) and end-stage renal disease. Hazard ratios (HRs) to the specific endpoints for metabolites that had pBH < 0.05 in crude survival models for the combined renal endpoint. Results for the three endpoints are shown in respective vertically arranged sub-figures. HRs are presented per 1 SD increase of the log2 metabolite and shown for crude model (left) and for model adjusted for age, sex, HbA1c, systolic blood pressure, smoking, body mass index, statin treatment, p-triglycerides, total p-cholesterol, eGFR, and logUAER (right).

