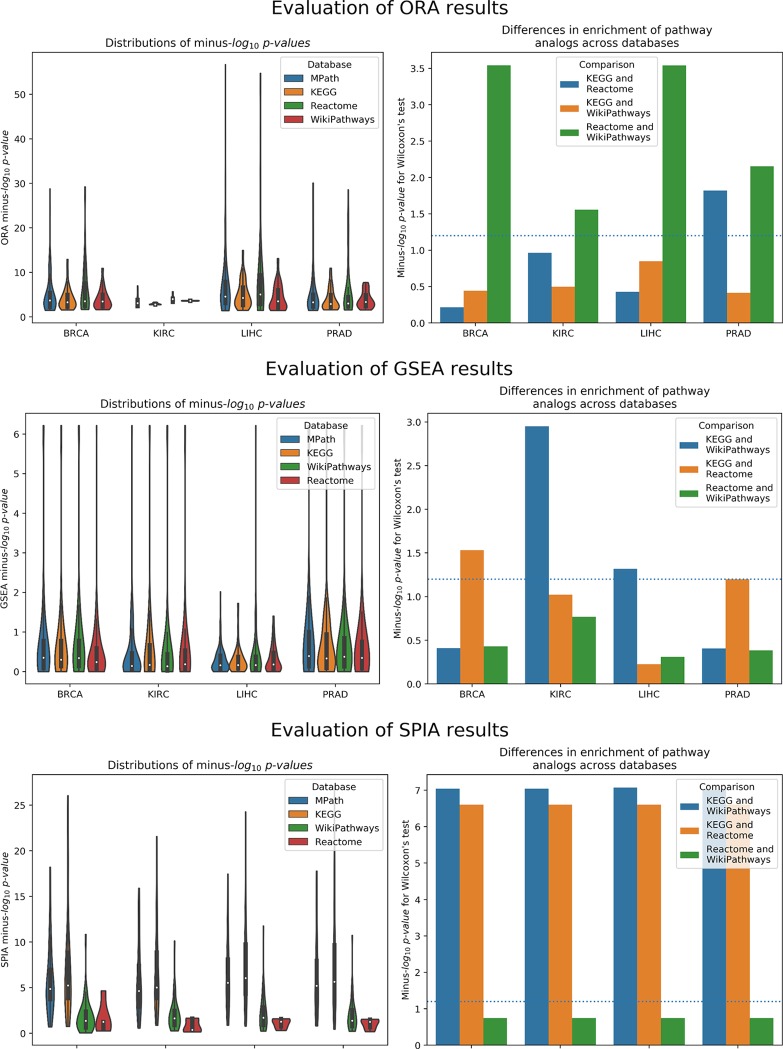
Figure 3.
Left Distribution of raw p values of pathway analogs across databases [top to bottom: overrepresentation analysis (ORA), gene set enrichment analysis (GSEA), and signaling pathway impact analysis (SPIA)]. Right Significance of average rank differences of pathway analogs across pairwise database comparisons for the given method.

