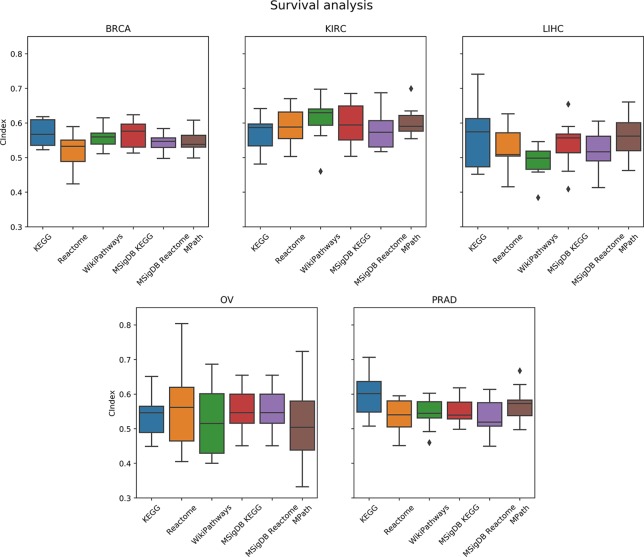
Figure 6.
Comparison of prediction performance of an elastic net penalized Cox regression model (overall survival) using single-sample gene set enrichment analysis (ssGSEA)-based pathway activity profiles computed from different resources. Each box plot shows the distribution of the area under the ROC curves (AUCs) over 10 repeats of the 10-fold cross-validation procedure.

