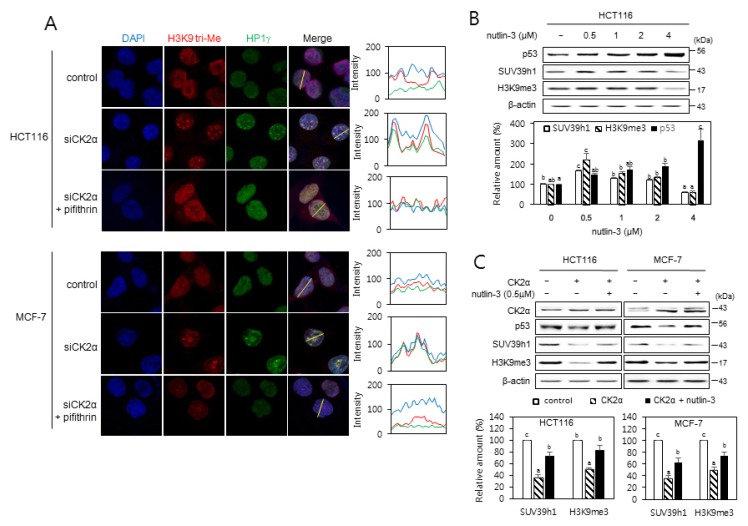
Fig. 2. p53-dependent induction of SAHFs formation after CK2 downregulation.
(A) Confocal immunofluorescent images (×800 magnification) showing the co-localization of chromatin foci with H3K9me3 (red) and HP1γ (green) in cells treated with CK2α siRNA in the presence of the p53 inhibitor pifithrin-α (30 μM). DAPI staining (blue) was used to visualize DNA foci. Fluorescence intensity was quantified using ImageJ software (right panels). Arbitrary intensity values for H3K9me3 (red), HP1γ (green), or DAPI (blue) are shown relative to the reference line (white) used for the analysis. (B and C) The effect of nutlin-3 on the expression of p53, SUV39h1, and H3K9me3. (B) Cells were treated with the MDM2 inhibitor nutlin-3 (0.5 to 4 μM) for 48 h. (C) Cells were treated with pcDNA3.1-HA-CK2α in the absence or presence of nutlin-3 (0.5 μM) for 48 h. Cell lysates were visualized by immunoblotting (upper panels). The graph shows the quantification of each protein relative to β-actin (bottom panels). The values indicate mean ± SEM. Bars that do not share a common letter (a, b, or c) are significantly different between groups at P < 0.05.

