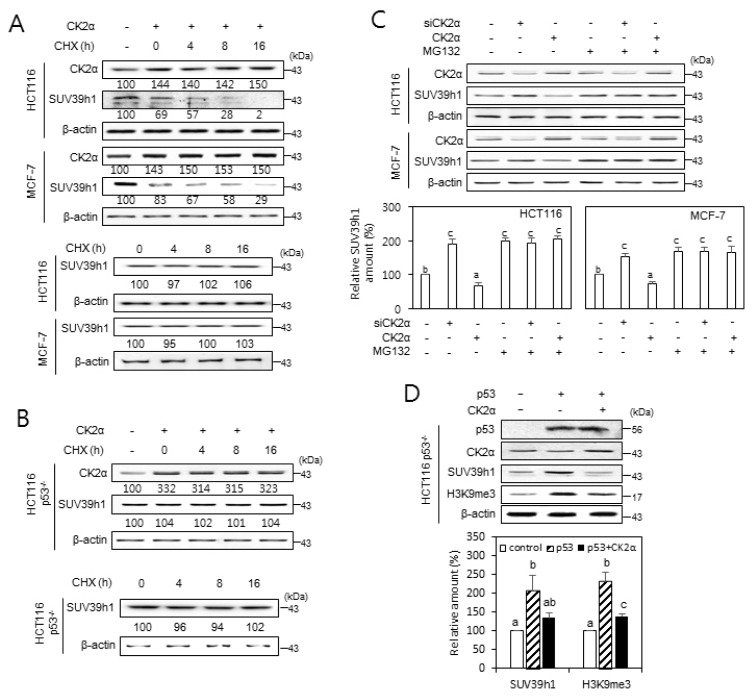
Fig. 3. The role of CK2 in regulating SUV39h1 expression.
(A and B) p53-dependent destabilization of SUV39h1 protein after CK2 upregulation. Wild-type p53 cells (HCT116 and MCF-7) (A) and p53-null cells (HCT116 p53−/−) (B) were treated with the protein synthesis inhibitor cycloheximide (CHX, 50 μg/ml) for the indicated times in the absence or presence of pcDNA3.1-HA-CK2α. The cell lysates were visualized by immunoblotting. The values below each band represent the mean fold differences (n = 3) in expression levels compared to the control, which was assigned a value of 100. (C) Cells were treated with CK2α siRNA or pcDNA3.1-HA-CK2α in the absence or presence of the proteasome inhibitor MG132 (10 μM) for 6 h. Cell lysates were visualized by immunoblotting (upper panel). The graph shows the quantification of each protein relative to β-actin (bottom panel). (D) CK2 overexpression compromises the p53-mediated induction of SUV39h1. Immunoblot analysis of cells treated with CK2α siRNA or pcDNA3.1-p53 (upper panel). The graph shows the quantification of SUV39h1 and H3K9me3 relative to β-actin (bottom panel). The values indicate mean ± SEM. Bars that do not share a common letter (a, b, or c) are significantly different between groups at P < 0.05.

