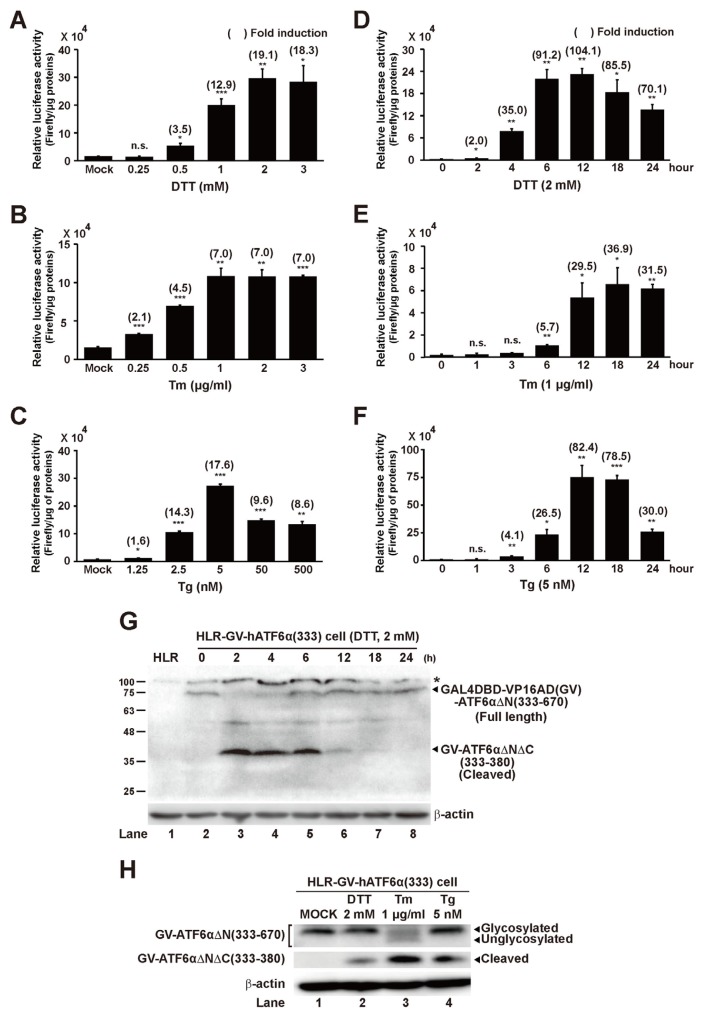
Fig. 3. Concentration and time-dependent effects of ER stress inducer treatments to HLR-GV-hATF6α(333) cell line and detection of GV-hATF6αΔN(aa 333–670) cleavage on ER stress-induced HLR-GV-hATF6α(333) cells.
(A–C) HLR-GV-hATF6α(333) cells were treated with DTT, Tm, or Tg at indicated concentrations for 12 h. (D–F) HLR-GV-hATF6α(3 33) cells were treated with DTT (2 mM), Tm (1 μg/ml), or Tg (5 nM) at indicated times. Firefly luciferase activities in cell lysates were measured. Results are given as absolute value of firefly luciferase activity to 1 μg of proteins in each cell lysate. The number in parenthesis indicates average fold induction relative to the untreated group. Data are expressed as mean ± SD of three independent experiments. *P < 0.05, **P < 0.01, ***P < 0.001 (untreated group vs each treated group); n.s., not significant. (G) HLR-GV-hATF6α(333) cells were treated with DTT (2 mM) for 2 h and then incubated with DTT-free medium for the indicated times. At indicated time points, cells were harvested and total cellular extracts were prepared and then subjected to Western blot analysis with anti-Gal4 and anti-β-actin antibodies. The asterisk (*) indicates non-specific bands in Western blot. (H) HLR-GV-hATF6α(333) cells were treated with DTT (2 mM), Tm (1 μg/ml), or Tg (5 nM) for 12 h as described in Materials and Methods section. Cells were harvested and total cellular extracts were prepared and then subjected to Western blot analysis.

