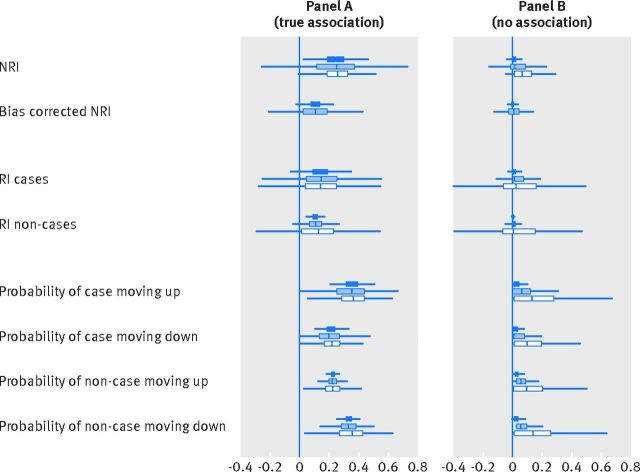
Fig 2.
Distribution of measures using cardiovascular disease cut points in a group at intermediate risk when the new marker has a true association (odds ratio of 2 for a 2 standard deviation difference) with the outcome (panel A) and no association (panel B). The boxes show the results when different populations are used to calculate the risk model with the new marker: dark blue boxes use the full population, light blue boxes use the scaled population (a random sample of the full population with the same number of participants as the intermediate risk population), and white boxes use the intermediate risk population as determined by the original model only. NRI=net reclassification improvement; RI=reclassification improvement

