
Figure 2.
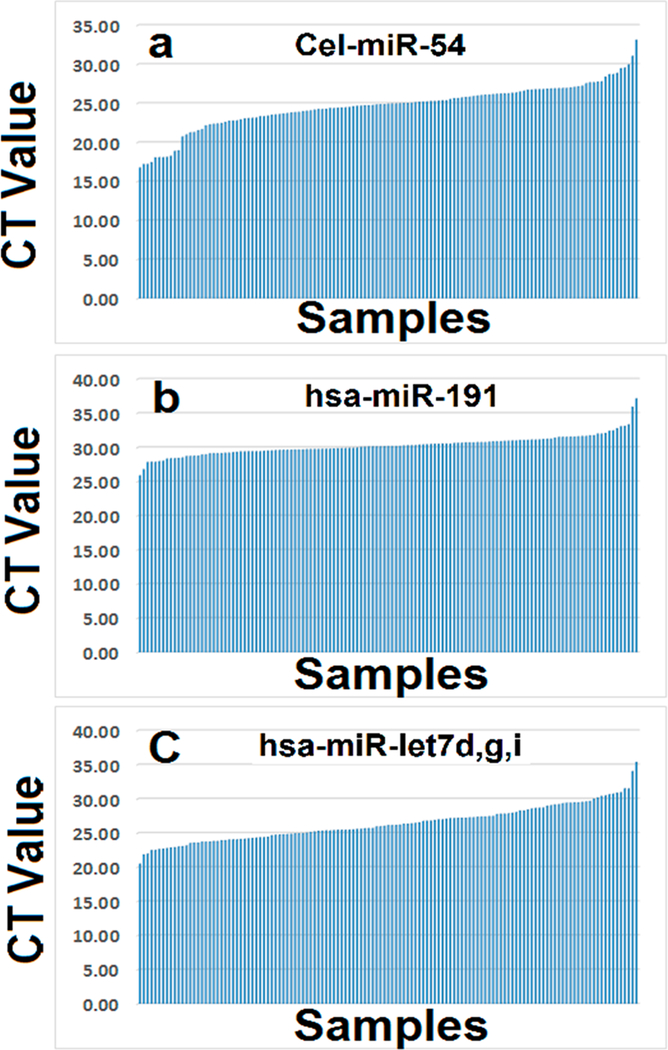
RT-qPCR CT values of external and internal reference controls in cancer and noncancer samples. CT values were sorted based on the number of a total of 129 samples including lung cancer, benign and normal healthy control plasma samples. (a) CT values of external C. elegans Cel-miR-54 across 129 samples. (b) CT values of endogenous reference control hsa-miR-191 across 129 samples. (c) CT values of endogenous reference control of averaged hsa-Let-miR-let 7d,g,i across 129 samples.