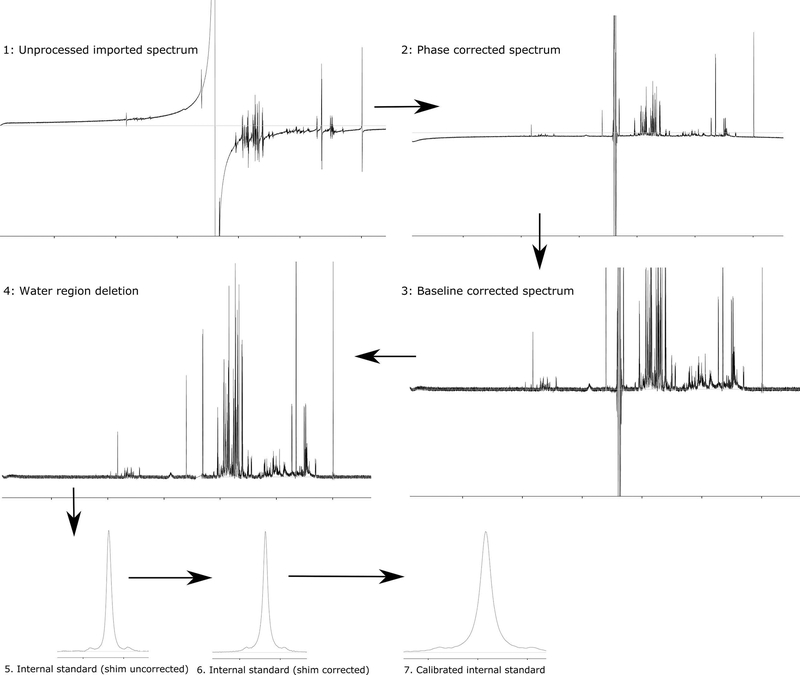
Figure 4: Processing pipeline for NMR spectrum.
The Chenomx processing pipeline is described here. However, the general steps will remain the same for other software. Raw FID is imported, and Fourier transformed, followed by phase correction, baseline correction, region deletion, shim correction and internal standard calibration. Perfect baseline and phase correction are crucial. The base of the peak and noise should be centered around the zero line (white line in panel 4) if a perfect phase and baseline correction is achieved.

