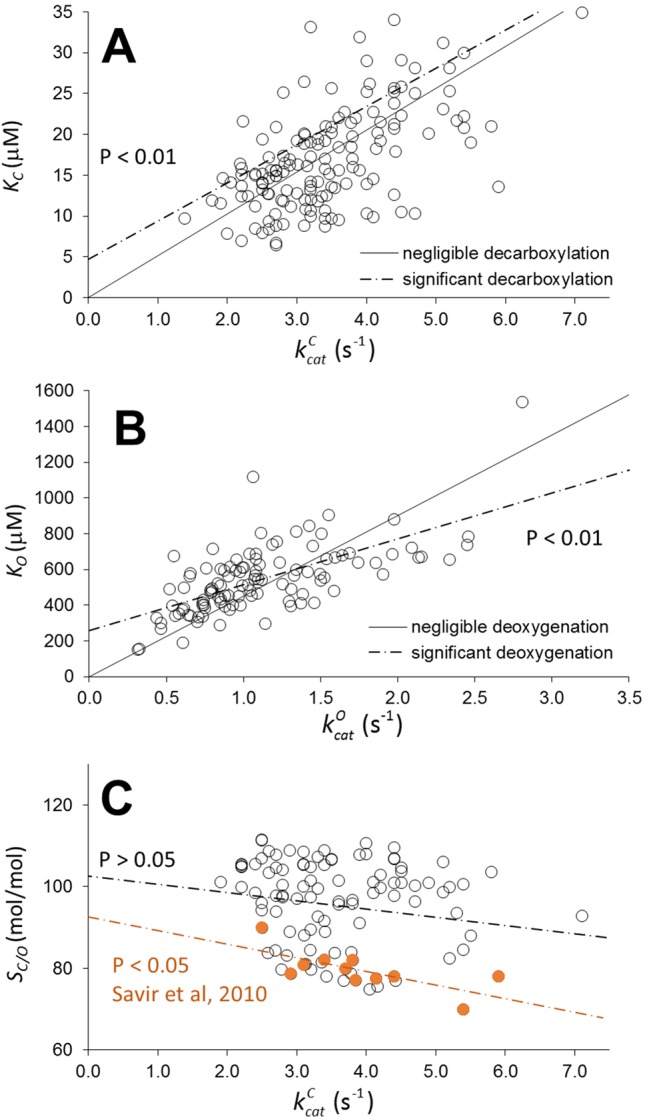
Figure 1.

Scatter plots of KC as a function of (A), K O as a function of (B), and relative specificity, SC /0, as a function of (C) for wild type in higher-plant Rubiscos from various data compilations (Ishikawa et al., 2009; Galmés et al., 2014; Orr et al., 2016; Prins et al., 2016; Cummins et al., 2018a). Assuming decarboxylation and deoxygenation are negligible in all Rubiscos, the solid lines (with zero intercept) were obtained by optimizing only the coefficients of and in the linear regression. The dashed lines were obtained by optimizing both the coefficient and intercept in the linear regression. Deviation of the dashed line from the solid line is statistically significant (with non-zero intercept, P< 0.01). From Equation 2, the intercepts are the product of the expected (estimation of the mean) values < k-m > and the corresponding slopes (1/< KRk6>). If the intercept is non-zero, < k-m > must also be non-zero, indicating the high likelihood of decarboxylation and deoxygenation in a significantly large number of Rubiscos. Furthermore, we have reproduced the trade-off between SC/0 and (C), from the data of Savir et al. (2010) used to demonstrate “optimality in a low dimensional landscape”; this shows that it is not mirrored when a larger sampling of data for plant Rubiscos is used.
