Figure 4.
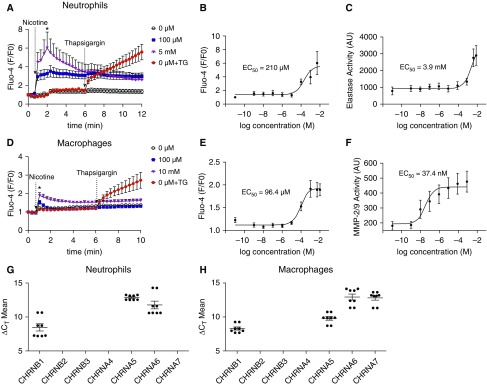
Nicotine causes dose-dependent increases in cytoplasmic Ca2+ and induces protease release from immune cells. Neutrophils and alveolar macrophages were loaded with the calcium indicator dye Fluo-4 direct and the change in fluorescence, as an indicator of cytoplasmic Ca2+, was recorded over time. The media was then sampled 4 hours after exposure to measure protease activity, as indicated by changes in cleavage of fluorogenic substrates specific to neutrophil elastase (NE) and MMP-2/9 (matrix metalloprotease-2/9). (A) Changes in Fluo4 fluorescence, as an indicator of cytoplasmic Ca2+ levels over time in peripheral blood neutrophils. (B and C) Dose responses to nicotine exposure in neutrophils for peak (2 min) increases in cytoplasmic Ca2+ levels and 3 hours secreted NE activity, respectively; n = 9 per group. Data were normalized to GAPDH expression; n = 8 per group. (D) Changes in Fluo-4 fluorescence, as an indicator of cytoplasmic Ca2+ levels, in BAL macrophages. (E and F) Dose responses to nicotine exposure in BAL macrophages for peak (2 min) increases in cytoplasmic Ca2+ levels after nicotine exposure and secreted NE activity, respectively; n = 9 per group. (G) Nicotinic acetylcholine receptor expression in peripheral blood neutrophils, as measured by quantitative PCR (qPCR). (H) Nicotinic acetylcholine receptor expression in alveolar macrophages, as measured by qPCR; n = 8 per group. *P ≤ 0.05 compared with control. Data are shown as mean ± SEM. Data were analyzed using Mann-Whitney U test (A and E) or fit to the equation Y = bottom + (top − bottom)/(1 + 10X − logIC50) (B, C, F, and G). AU = arbitrary unit; ΔCT = delta cycle threshold; CHRN = cholinergic receptors nicotinic subunit; EC = effective concentration; F/F0 = ratio of final to initial fluorescence; TG = thapsigargin.

