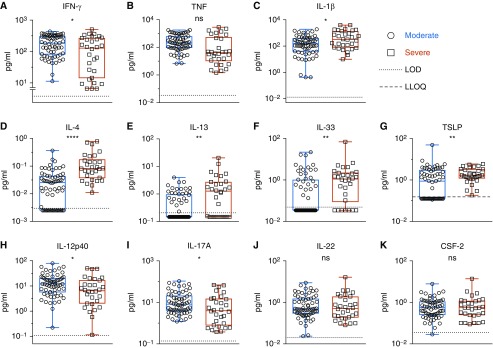
Figure 2.
Infants with severe respiratory syncytial virus disease express higher levels of type 2 cytokines. Cytokine expression in nasal aspirates, collected within 24 hours of enrollment, was compared between patients with severe (n = 30) and moderate disease (n = 63) and are represented as box-and-whisker plots. Whiskers represent maximum and minimum values; boxes represent 25th–75th percentiles. The median is represented by the middle line. Significance was determined using the Mann-Whitney U test. *P ≤ 0.05, **P ≤ 0.01, and ****P ≤ 0.0001. LLOQ = lower limit of quantification; LOD = limit of detection; ns = nonsignificant.

