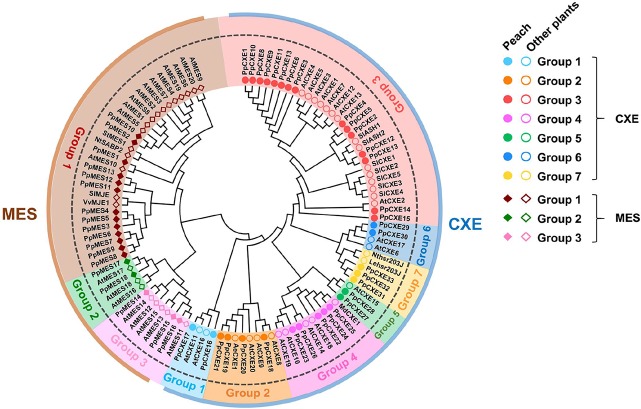
Figure 1.
Phylogenetic analysis of CXE and MES families. The full-length amino acid sequences were aligned to construct the phylogenetic tree. The accession numbers of members are listed in Tables S1 and S2 . AeCXE1 (Q0ZPV7.1) from Actinidia eriantha and StMES1 (XP_006360243.1) from Solanum tuberosum are also included in the phylogenetic tree. The dots and circles represent CXEs from peach and other plants, respectively; filled and empty diamonds represent MESs from peach and other plants, respectively.

