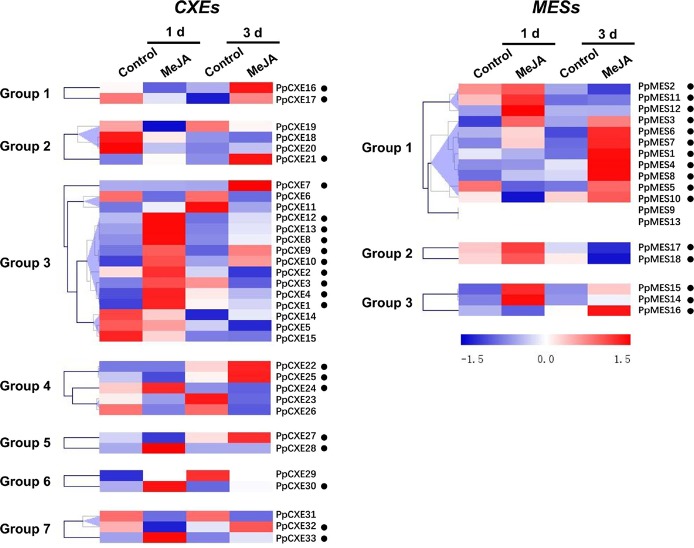
Figure 6.
Expression pattern of peach CXE and MES genes in response to MeJA treatment. The expression pattern was analyzed by heatmap hierarchical clustering. 1 d and 3 d represent days after MeJA treatment. Numbers on the left represent the phylogenetic groups. The black dots indicate the genes whose transcript levels were up-regulated by MeJA. The color scale is shown on the right; red represents high content, blue represents low content.

