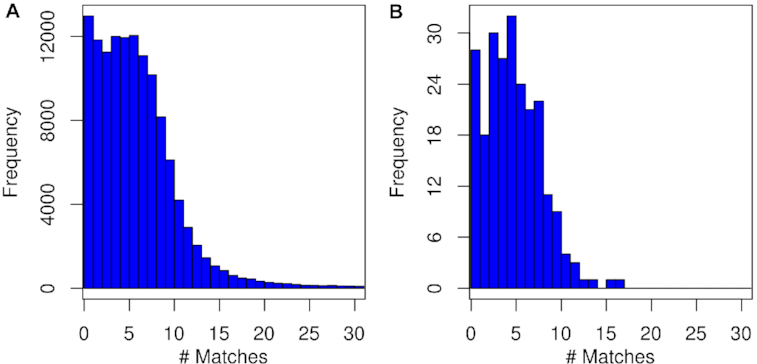
Figure 1:

Frequency histogram of expressed sequence tags (ESTs) and CEGMA region alignment on sugarcane genome assembly. For 125,072 aligned ESTs, 106,133 (84.8%) show 2–30 matches on the genome (A), while for CEGMA regions, 205 (87.2%) range from 2 to 17 matches on the genome (B). SPALN v 2.3.3 [32] was used for alignment.
