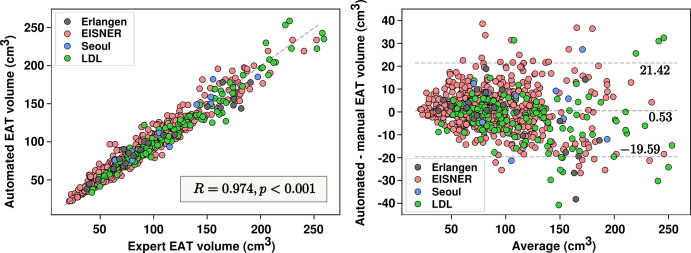
Figure 2:
Automated volume quantifications versus human measurements. Scatterplot (left) and Bland-Altman plot (right) show epicardial adipose tissue (EAT) volume measurements and agreement between the automated quantifications and the expert manual measurements. EISNER = Early Identification of Subclinical Atherosclerosis by Noninvasive Imaging Research, LDL = low-density lipoprotein.

