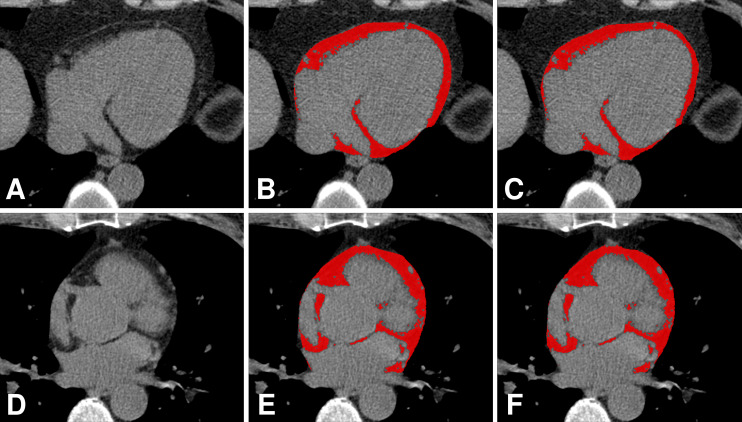
Figure 3:
Comparison of manual annotation by an expert reader and automatic segmentation of epicardial adipose tissue by an algorithm. A, D, Axial non–contrast-enhanced CT images show the heart without the EAT identified; B, E, EAT as identified by the expert (red areas); and C, F, EAT as identified automatically by the algorithm (red areas).

