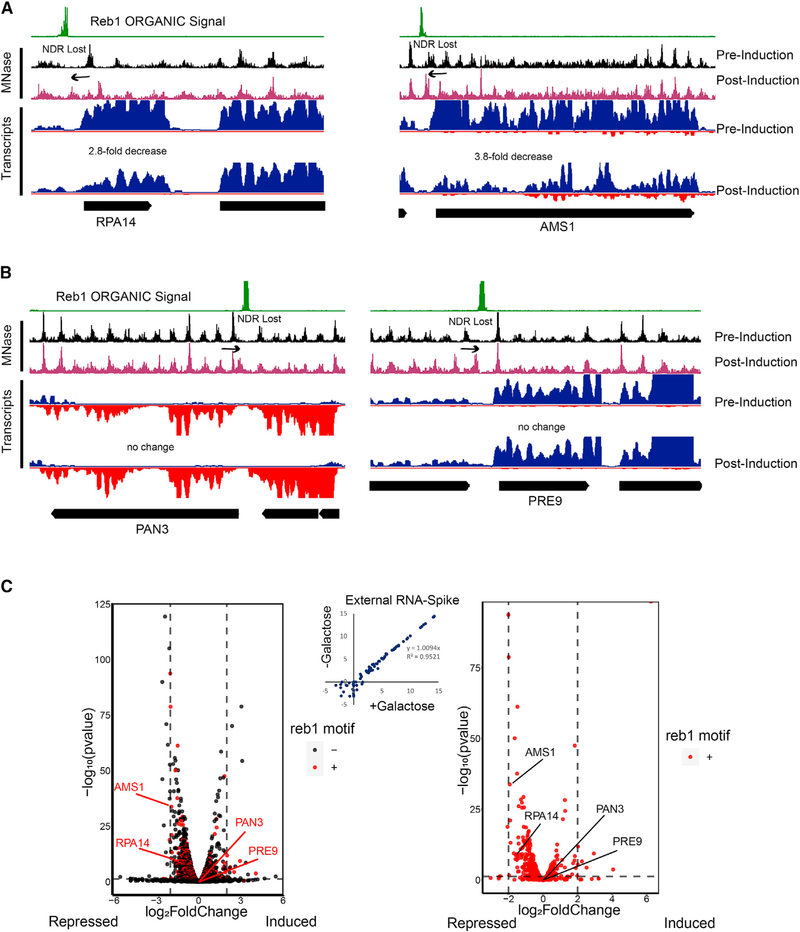
Figure 6. Loss of NDR by Reb1-Tethered SpyCatcher E-ChRP Is Generally Repressive.
(A) Representative Genome Browser images showing loss of NDR and associated transcriptional reduction by SpyCatcher E-ChRP at Reb1-bound loci.
(B) Representative Genome Browser images showing significant reduction of NDR size by SpyCatcher E-ChRP without detectable changes in transcription at Reb1-bound loci.
(C) Volcano plots showing transcription changes (x axis) and statistical significance (y axis) associated with SpyCatcher E-ChRP induction in Reb1-SpyTag strains for all genes (left) or genes containing Reb1 binding motifs in their promoter regions (right). Loci from (A) and (B) are labeled. Vertical dashed lines indicate 4-fold transcription change. Horizontal dashed line represents a corrected p value threshold of 0.01. p values were calculated in DEseq2 using the default Wald test. Most motif-containing genes with significant changes in transcription move in the repressive (left) direction. Scatterplot showing no change in global transcription as measured by External RNA Controls Consortium (ERCC) spike-in RNA control is provided (center).

