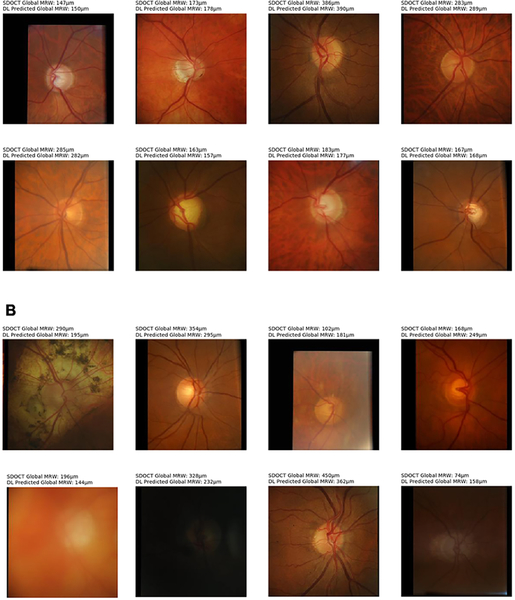
Figure 3.
Random examples of optic disc photos from the test sample along with the corresponding global minimum rim width (MRW) relative to Bruch’s membrane opening deep learning (DL) predictions and spectral domain-optical coherence tomography (SDOCT) measurements. (Top) Random examples where predictions closely agreed to observations (within 20μm). (Bottom) Random examples where the predictions disagreed with the observations (greater than 50μm difference).

