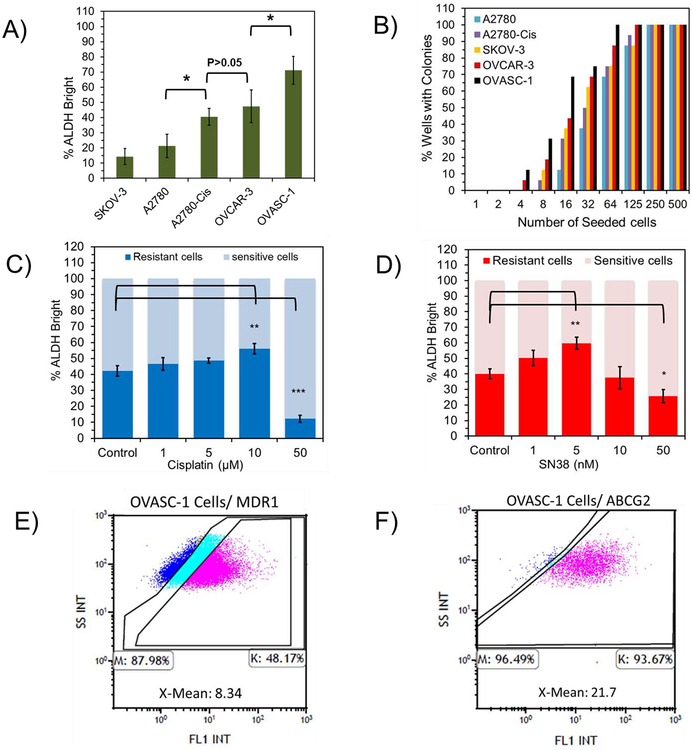
Figure 1:
Assessment of the percentages of drug-resistant cells and CICs. A) Determination of the percentage of the of ALDH+ (bright) cells in the general population of ovarian cancer cells by ALDH assay. B) Measurement of the percentage of the CICs in each ovarian cancer cell population by Limiting Dilution Assay. For details of data analysis, please see Figure S3B. C–D) Change in the percentage of ALDH+ cells in OVASC-1 cells after treatment with cisplatin (1–50 μM) and SN-38 (1–50 nM). The total number of cells (sensitive and resistant) as measured by flow cytometry is normalized to 100%. E-F) The percentages of OVASC-1 cells that express MDR1 and ABCG2 transporters. X-mean (Mean Fluorescence Intensity) denotes the fold difference in between the expression of the transporters on the surface of OVASC-1 cells stained by the anti-MDR1/anti-ABCG2 antibodies and by the IgG isotype control. This fold difference in X-Mean indicates the transporter density on the surface of the cells.

