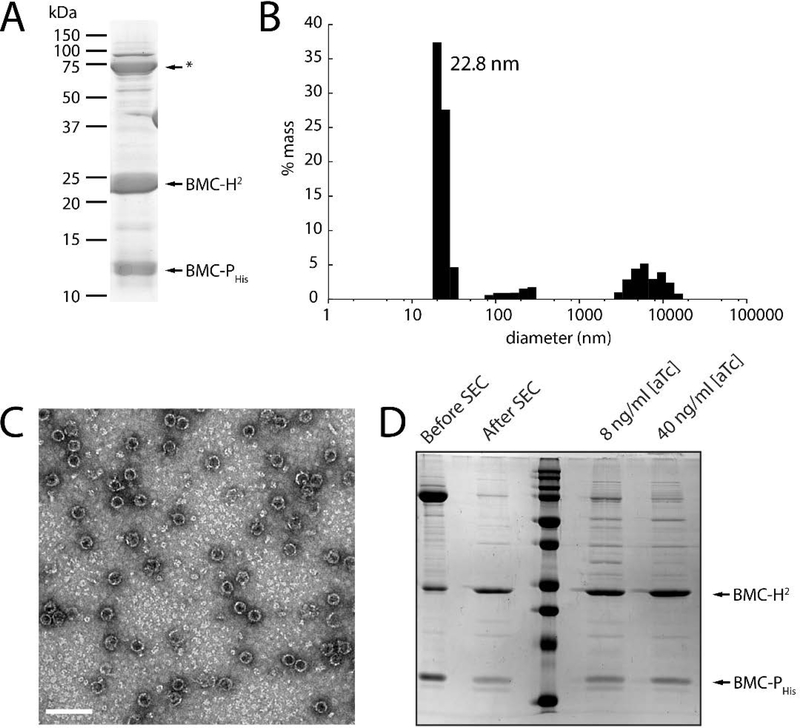
Figure 4. Characterization of in vivo assembled BMC-H2 shells in the presence of BMC-PHis.
A: SDS-PAGE analysis of concentrated HisTrap elution fractions. A common contaminant from the HisTrap is indicated by an asterisk. B: Size distribution of concentrated HisTrap elution fractions from (A) using Dynamic Light Scattering. C: TEM micrograph of the sample in (A). Diameter = 26 ± 2 nm (n=407). Scale bar = 100 nm. D: SDS-PAGE analysis showing the removal of excess pentamer with a size exclusion step (left two lanes) and samples purified from strains expressing BMC-Phis at two different induction levels.

