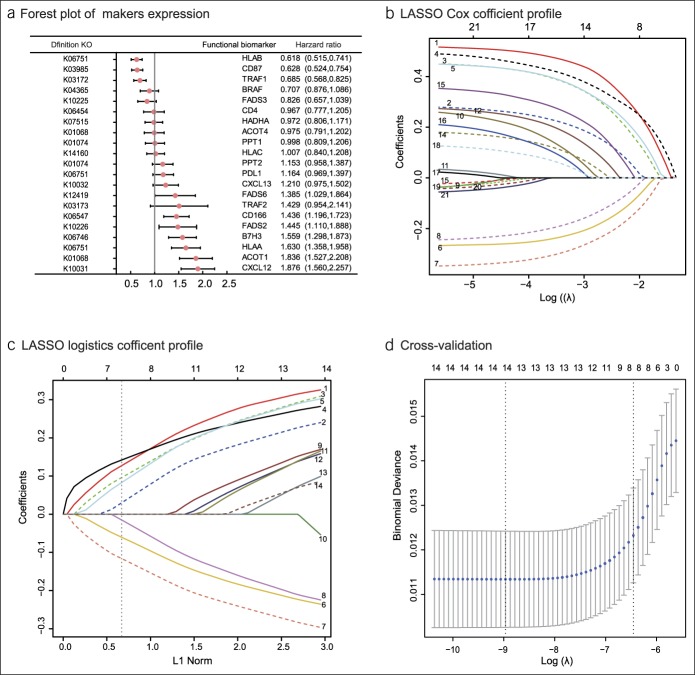
Figure 2.
Construction of the compound score model. (a) A forest plot showing associations between different proteins and overall survival in the training set. Unadjusted hazard ratios are shown with 95% confidence intervals. (b) LASSO Cox regression coefficient profiles of the fractions of 21 immune and lipid metabolism proteins in the entire set. (c) LASSO logistic regression coefficient profiles of the fractions of 14 functional proteins in the training set. 1, ACOT1; 2, CD166; 3, B7H3; 4, CXCL12; 5, HLAA; 6, CD87; 7, HLAB; 8, TRAF1; 9, CXCL13; 10, PDL1; 11, TRAF2; 12, FADS2; 13, FADS6; and 14, PPT2. The dotted line indicates the value chosen by 10-fold cross-test. (d) Ten-fold cross-test for tuning parameter selection in the LASSO model. The partial likelihood deviance is plotted against log (λ), where λ is the tuning parameter. Partial likelihood deviance values are shown, with error bars representing s.e. The dotted vertical lines are drawn at the optimal values by minimum criteria and 1 − s.e. criteria. LASSO, least absolute shrinkage and selection operator.

