Figure 1.

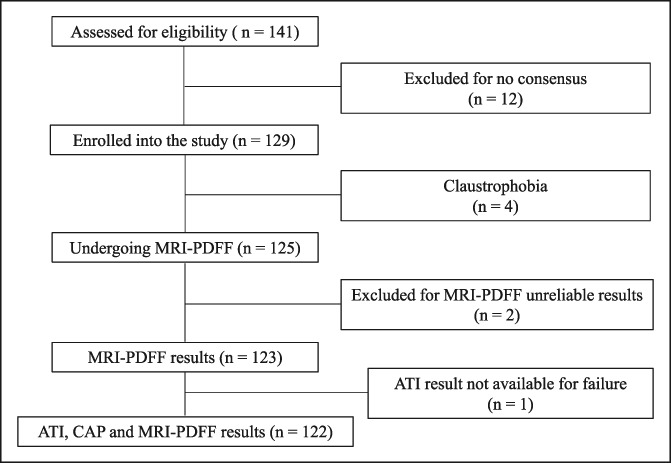
Flow chart of the study. CAP measurements: n = 125; ATI measurements: n = 124. ATI, attenuation imaging; CAP, controlled attenuation parameter; PDFF, proton density fat fraction.

Flow chart of the study. CAP measurements: n = 125; ATI measurements: n = 124. ATI, attenuation imaging; CAP, controlled attenuation parameter; PDFF, proton density fat fraction.