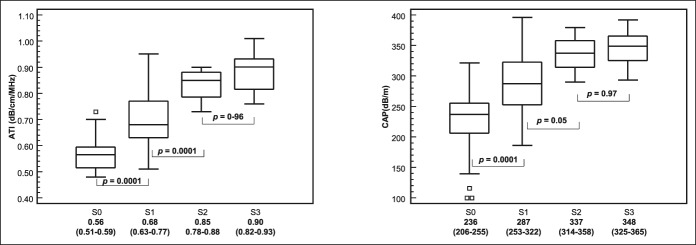
Figure 2.
MRI-PDFF steatosis grade: <5%: S0 (n = 36), 5%: S1 (n = 65), 16.3%: S2 (n = 8), 21.6%: S3 (n = 14). Median values and interquartile range (in parenthesis) for each fibrosis stage and P values of differences between consecutive grades are given. The central box represents values from the lower to upper quartile (25–75 percentile). The middle line represents the median. A line extends from the minimum to the maximum value (range), excluding “outside” values, which are displayed as separate points. The difference among steatosis grade was evaluated with one-way analysis of variance by ranks (Kruskal–Wallis test) adjusted with post hoc Bonferroni test. ATI, attenuation imaging; CAP, controlled attenuation parameter; CI, confidence interval; PDFF, proton density fat fraction.

