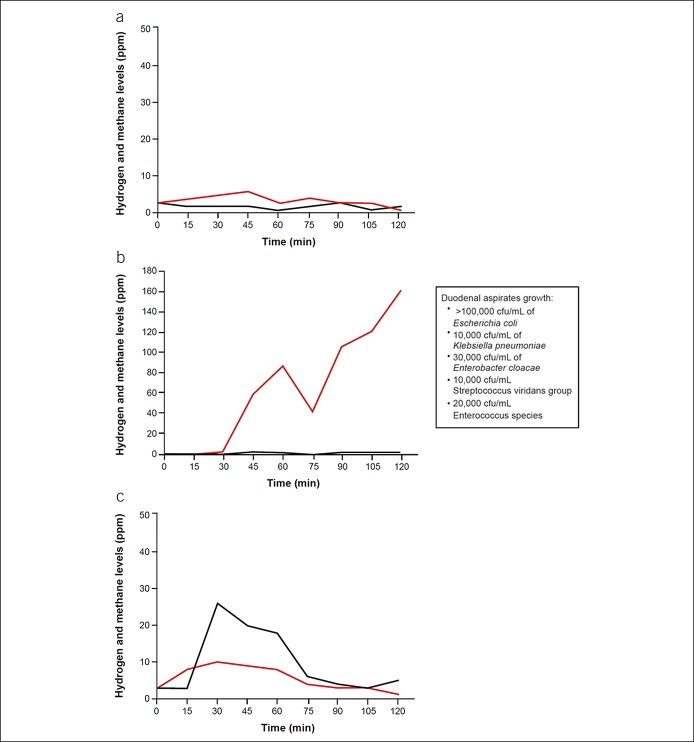
Figure 2.
Typical example of breath test results: Shown are a negative breath test result (a), a positive hydrogen breath test showing hydrogen concentration rising >20 ppm from baseline (b), and a positive breath test showing methane concentration rising >10 ppm from baseline (c). Red lines show hydrogen concentrations, and black lines show methane concentrations. Duodenal aspirates and culture results are shown in the text inset of (b).

