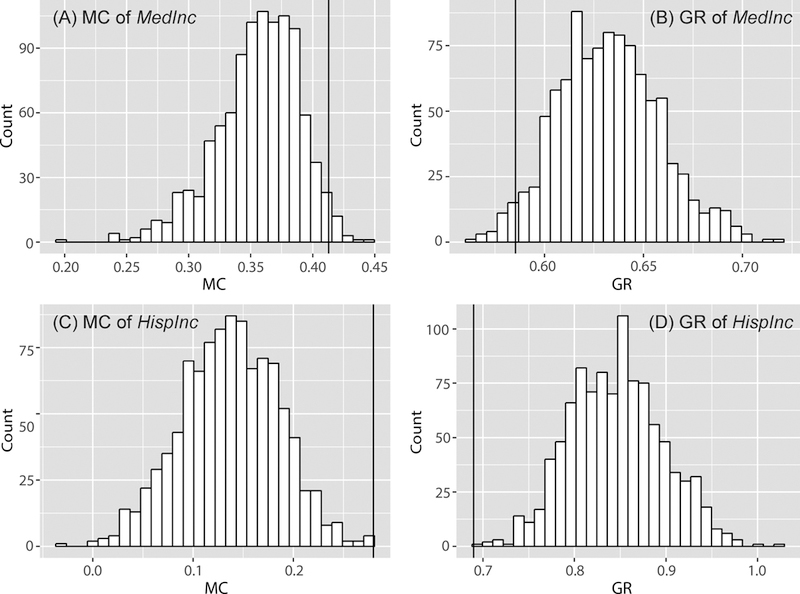
Figure 3.

The distributions of MC [(A) and (C)] and GR [(B) and (D)] of the 1,000 sets of new estimates of the two variables generated by incorporating errors into the estimates. The MC and GR values without error information are shown by the vertical lines.
