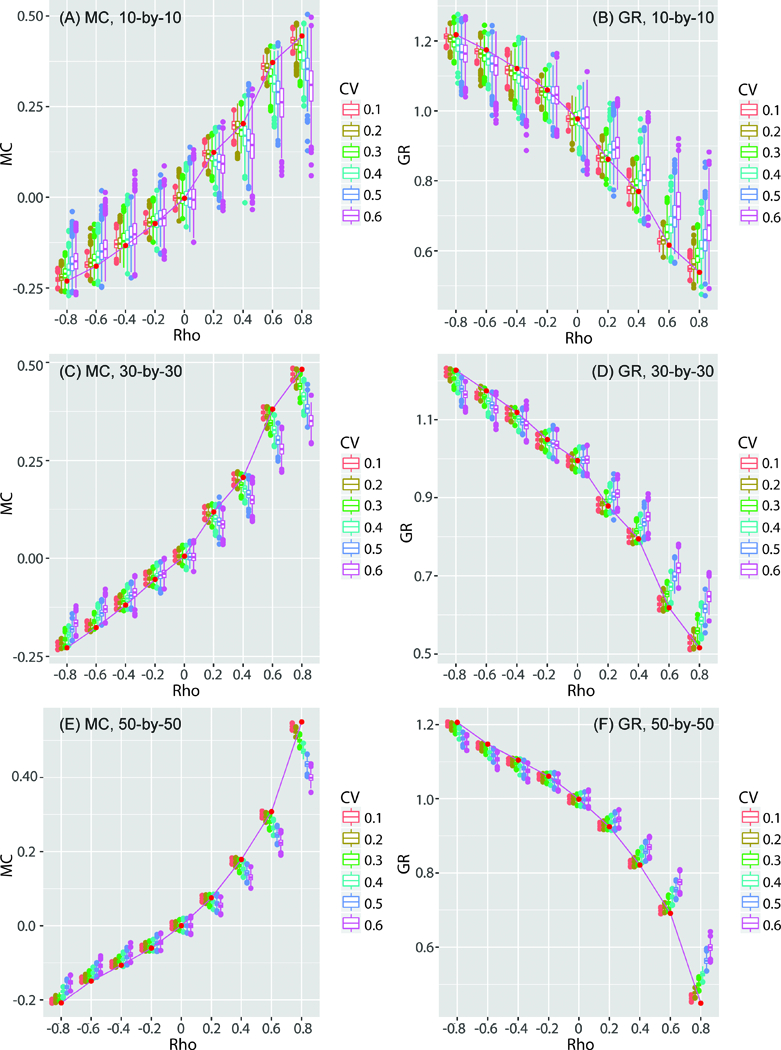
Figure 4.

The distributions of MC and GR for the 1,000 sets of the random samples generated by incorporating errors into the estimates. The (red) points connected by line segments represent the SA statistics of the original simulated estimates (54 of them). The boxplots show the distributions of the SA statistics of estimates generated with errors.
