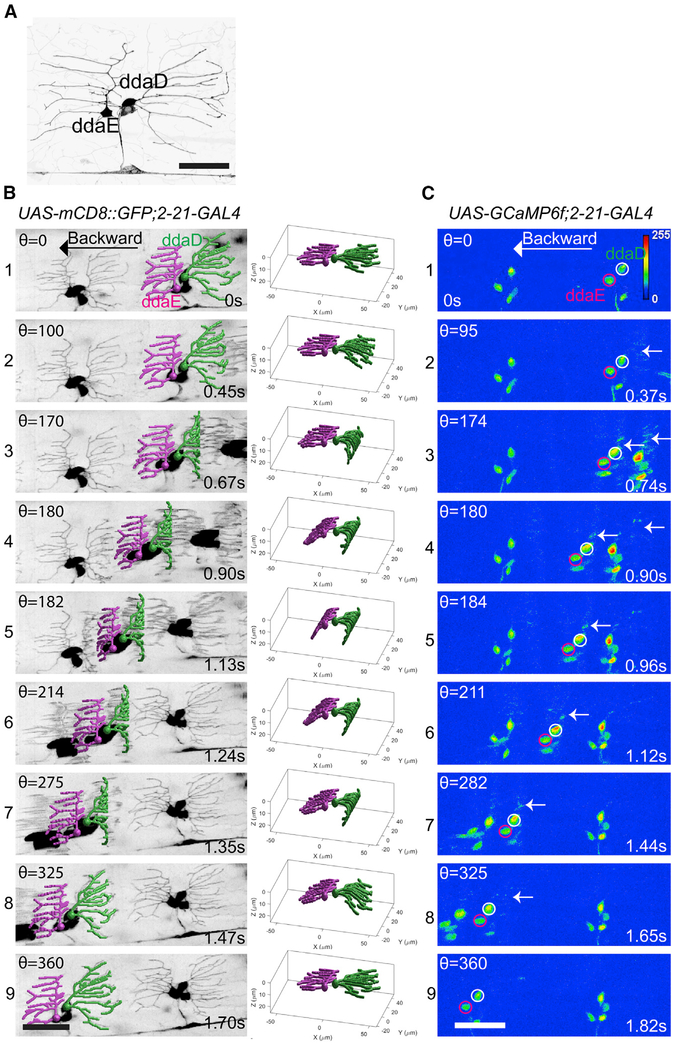
Figure 2. Dendrite Deformation and GCaMP6f Activation Patterns in Larval Backward Locomotion.
(A) Dendrite morphology of class I da neurons ddaE and ddaD visualized by expression of mCD8::GFP driven by 2-21-GAL4.
(B) Dendrite deformation pattern of ddaE and ddaD during backward locomotion. The left panel shows individual time points of a maximum-intensity projection from a volumetric time series. The right panel depicts the model of dendritic architecture reconstituted by a computer vision framework for neurite tracing from the volume shown in the left panel. ddaE and ddaD are colored in magenta and green, respectively.
(C) GCaMP6f activation pattern of ddaE and ddaD in backward locomotion. Representative images at the nearly similar phase of segmental contraction cycle shown in the left panel of(B) are selected to show the activation of GCaMP6f. ddaE and ddaD cell bodies are marked with magenta and white circles, respectively. Arrows point to activated GCaMP6f in ddaD dendrites.
Maximum-intensity projections of confocal z time series are shown in (A) and (C). Stage of segmental contraction cycle (Θ) and corresponding time stamp (s) are shown in (B) and (C). All images are show as dorsal side up and anterior on the right. Scale bar, 40 μm. See also Figures S1 and S2 and Videos S1, S2, S3, and S5.

