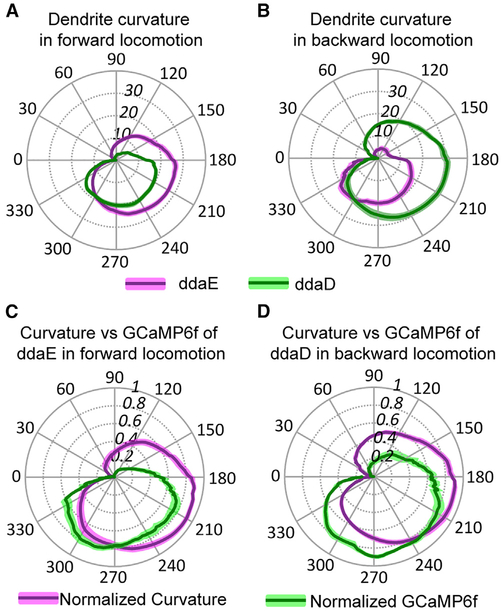
Figure 5. Comparison of Dendrite Curvature and GCaMP6f Activation during Larval Locomotion.
(A and B) Dendrite curvature of ddaE and ddaD neurons plotted versus phase of the segmental contraction cycle. Position along the radial axis represents absolute value of curvature. The phase angle of the segmental contraction cycle depicts the distance between adjacent neurons, which is decreasing from 0–180 degrees and increasing from 180–360 degrees. Solid lines represent the mean ofcurvature (n = 21 from seven animals for forward locomotion; n = 10 from six animals for backward locomotion), and colored shading represents the SEM. Overall, the curvature of ddaE is larger than that of ddaD during forward locomotion (A) and vice versa during backward locomotion (B). (C and D) Normalized dendrite curvature and GCaMP6f signals plotted on the same polar coordinates show that dendrite curvature precedes the rise in GCaMP signal and decreasing of curvature anticipates the decline of GCaMP6f signals for ddaE during forward locomotion (C) and ddaD during backward locomotion (D). Solid lines represent the mean of normalized curvature or GCaMP6f (curvature: n = 11 from four animals and n = 8 from four animals forforward and backward locomotion, respectively; GCaMP6f: n = 12 from five animals and n = 9 from five animals for forward and backward locomotion, respectively). Colored shading represents the SEM. n indicates the number of neurons examined.
See also Figures S2 and S3 and Video S8.

