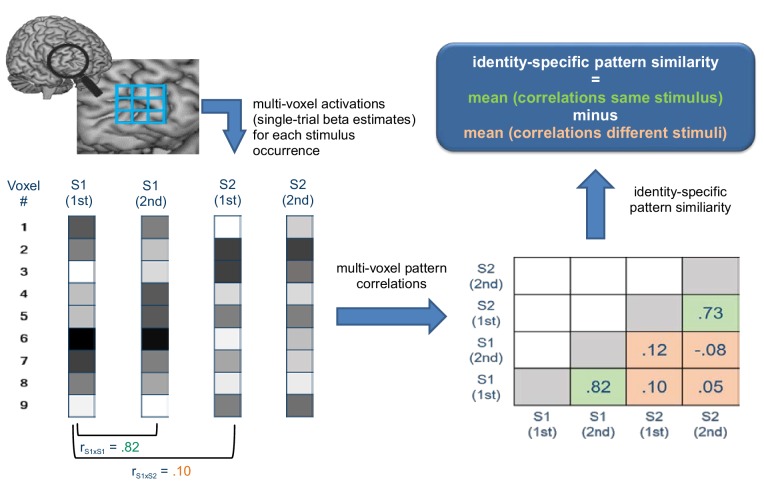
Figure 3. Schematic illustration depicting how identity-specific multi-voxel pattern similarity was computed exemplarily for one implementation stage in one learning block.
For illustrative purposes, only two stimuli (S1 and S2) each occurring twice are considered here (instead of 4 stimuli in reality). Bottom left: For each stimulus occurrence voxel-wise beta estimates (visualized by grayscale values) are arranged in vectors that constitute the basis of multi-voxel pattern correlations. Bottom right: matrix values depict multi-voxel pattern correlations for all combinations of trials. Green cells denote correlations between same stimuli, orange cells denote correlations between different stimuli. Top right: Identity-specific pattern similarity is defined by significantly greater mean correlations in green cells compared to orange cells.

