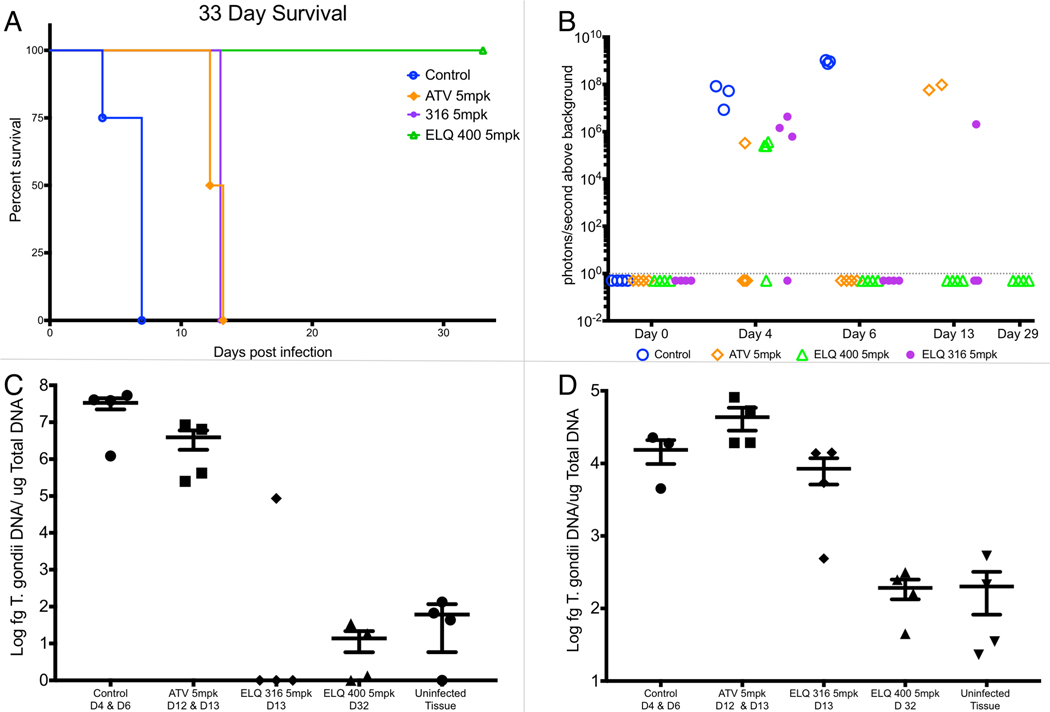
Figure 4. In vivo efficacy of oral administration of 5mg/kg atovaquone, ELQ-316 (3B) and ELQ-400 (8B.).

Figure 4A. Survival of treatment groups compared to vehicle-treated controls. All 4 mice treated with ELQ-400 (8B) were alive at the completion of the experiment. The difference in survival between the ELQ-400 (8B) group and control group, ELQ-316 (3B) group and control group and ELQ-316 group and ELQ-400 group were statistically significant (p = .01 by logrank analysis). Figure 4B. Luminescence in mice measured during the experiment. At day 4, luminescence from infection was detectable in each treatment group, but was below the limits of detection at day 6 in treatment groups. At day 13, luminescence was detectable in the 2 surviving mice in the atovaquone group and 1 of 3 mice in the 3B group; however, the remaining 3 mice displayed signs of infection and were euthanized. The dotted line indicates the limits of detection. Figure 4C. Quantitative real-time PCR of T. gondii DNA from splenic tissue. T. gondii DNA was not detected above the limits of detection in the spleen of 3 of 4 mice treated with ELQ-316 and none of the mice treated with ELQ-400. The differences between the ELQ-400 group and control group, and the ELQ-316 group and the control group were statistically significant (p = .02). Figure 4D. Quantitative real-time PCR of T. gondii DNA from brain tissue. All mice treated with ELQ-316 had T. gondii infection in brain tissue, whereas mice treated with ELQ-400 (8B) did not have infection detectable by PCR. The difference between ELQ-400 (8B) and control was statistically significant (p=.02 Student’s t-test). Quantitative real time PCR values from ELQ-400 treated mice were not statistically different from the values from uninfected tissue. D: day, bars and error bars represent the mean and standard error of the mean, respectively.
