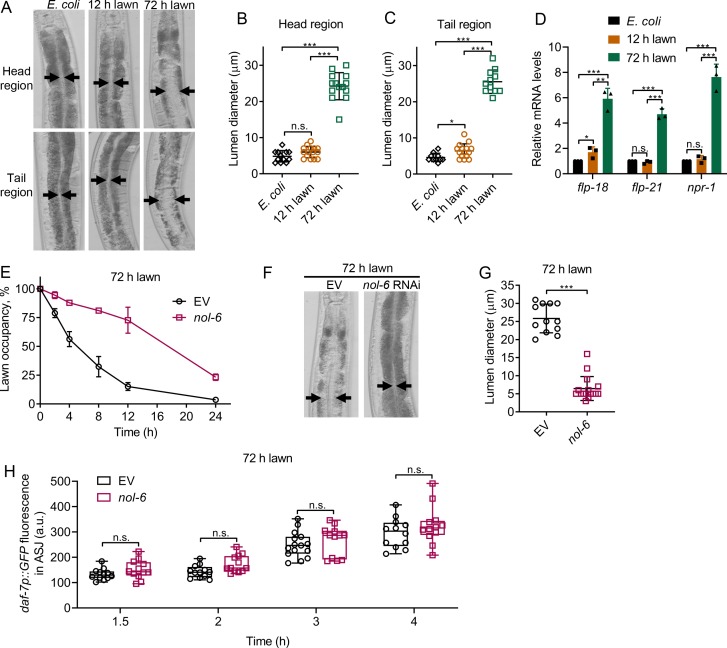
Figure 3. Intestinal lumen bloating underlies the avoidance behavior towards P. aeruginosa.
(A) Representative photomicrographs of N2 animals exposed for 8 hr to E. coli lawns, and 12 and 72 hr lawns of P. aeruginosa. Representative photomicrographs of the head and tail regions are shown. Arrows point to the border of the intestinal lumen. (B and C) Quantification of the diameter of the intestinal lumen of N2 animals exposed for 8 hr to E. coli lawns, and 12 and 72 hr lawns of P. aeruginosa from the head (B) and tail (C) regions. ***p<0.001 and *p<0.05 via the t test. n.s., non-significant. (D) Gene expression analysis of N2 animals grown on E. coli until the young adult stage, followed by incubation for 8 hr on E. coli lawns, and 12 and 72 hr lawns of P. aeruginosa. The black symbols represent individual data points. ***p<0.001, **p<0.01, and *p<0.05 via the t test. n.s., non-significant. (E) Time course of the percent occupancy of the control (EV) as well as nol-6 RNAi animals on 72 hr lawns of P. aeruginosa. (F) Representative photomicrographs of N2 animals grown on control and nol-6 RNAi exposed for 8 hr to 72 hr lawns of P. aeruginosa. Arrows point to the border of the intestinal lumen. (G) Quantification of the diameter of the intestinal lumen of N2 animals grown on control and nol-6 RNAi exposed for 8 hr to 72 hr lawns of P. aeruginosa. ***p<0.001 via the t test. (H) Time course of induction of daf-7p::GFP in ASJ neurons in animals grown on control and nol-6 RNAi and exposed to 72 hr lawns of P. aeruginosa. n.s., non-significant via the t test.


