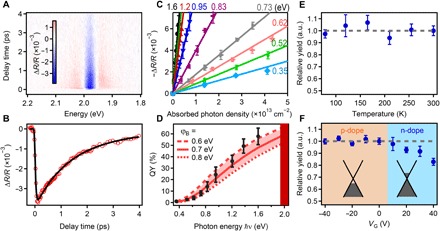
Fig. 3. Hot electron transfer from photoexcited graphene to WS2 monolayer.

(A) Color plot of TR spectra of Gr/WS2 heterostructure under 1.6-eV excitation, clearly showing the A exciton bleach of WS2 under sub-bandgap excitation. (B) TR kinetic at WS2 A exciton bleach in Gr/WS2 heterostructure showing ~25-fs rising and a ~1.2-ps decay process, corresponding to a hot electron transfer from graphene to WS2 and a subsequent back electron transfer process. The black line is the exponential fit. (C) Peak amplitude of TR signal for different photon energies as a function of absorbed photon density, showing a clear linear dependence. Solid lines are linear fits. Higher photon energy leads to larger peak amplitude due to hotter carrier distribution. (D) Experimentally determined QY (black circles) of hot electron transfer as a function of photon energies showing continuous increase with photon energy. Lines are predicted QY based on 2μPTE with different barrier heights (0.6, 0.7, and 0.8 eV). Relative hot electron injection yield (ℏν = 1.6 eV and Nphoton = 4 × 1012 cm−2) as a function of (E) sample temperatures (78 to 298 K) and (F) back-gating voltages (−40 to 40 V). The hot electron injection process shows negligible dependence on sample temperature. The electron inject yield is not affected by hole (p) doping but decreases with increasing electron (n) doping. a.u., arbitrary units.
