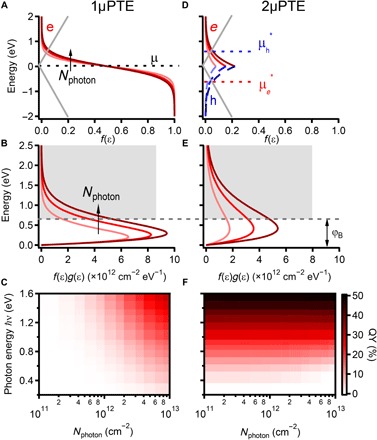
Fig. 4. Comparison between conventional 1μPTE model and proposed 2μPTE model.

(A) 1μ and (D) 2μ models where photoexcitation generates thermalized electrons characterized with one FD distribution in the former but quasi-thermalized electrons and holes with two FD distributions in the latter. Zero denotes the Dirac point. Nphoton increases as 2 × 10¹², 4 × 10¹², and 6 × 1012 cm−2, and ℏν is fixed at 1.6 eV. Electron distribution above the Dirac point in graphene with (B) 1μ and (E) 2μ models at different absorbed photon densities. Hot electrons above the barrier height (φB) can inject into the semiconductor conduction band. A much higher fraction of energetic electrons are observed in 2μ model. Color plot of predicted electron injection QY as a function of photon energy and density with (C) 1μPTE and (F) 2μPTE models. φB was chosen to be 0.7 eV, and all electrons above φB were assumed to inject into the semiconductor conduction band. QY shows a strong dependence on both photon energy and density in the 1μPTE pathway but remains nearly constant with varying photon density in the 2μPTE pathway.
